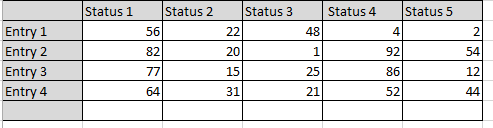
I everybody, i’m just starting with Grafana. I’m using Elasticsearch with grafana and I would like to know if is it possible to make a double entry table like below :
Each of my elasticsearch document have a field Entry who can take 5 different values and each docuement have a field status who can take 6 different values.
I think I’m attempting to do the same thing. I’m doing a query against ElasticSearch that should result in Eventlogs being returned. I’m trying to create a table that would be of the number of errors/warnings in the given window. I want it to be dynamic so I want to use terms for both the level:Warn/Err and the hostname, which could be added or removed by when the window is.
Table I want would look like this:
Host Warn Err
Host1 25 1
Host2 30 20
ETC…
I would be happy with 2 queries, A and B. but I can’t get them to be the Columes, only another row which results in a table like this
Host Count
host1 1
host1 25
host2 30
host2 20
This doens’t look good and takes up twice the space. Any help would be appreciated. I believe the solution may be table transformation to Json but that doesn’t populate the columns field.