I use graphite as datasource.
Using timeseries in X-axis.
Trying to plot metrics and using alias.
- one problem is that there is no line connecting the different points plotted https://community.grafana.com/t/getting-line-connected-points-over-a-series/164/10 , for which i understand that each point is a series and cannot be connected.
- As a workaround, i’m planning to show the different node criteria as different graphs.
Now, if i plot the same graph using influxDB, then i will get the series connected and legend value showed for tags.
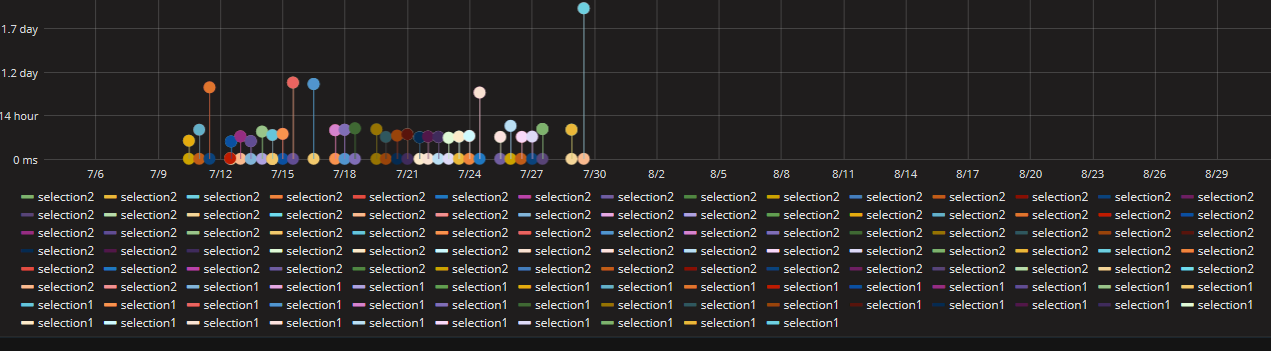
Whereas, if i use graphite, then even on using alias, i get a legend displayed for every point. This becomes a problem when i try to plot more than one node selection on the same graph.
What is the solution to get only unique legend value displayed? If there is a way to achieve it, then i can use same color for the legend and differentiate the points.