That’s not possible if you use Series mode. Series mode is quite simple. Most of the display settings are for Time mode (which is how most people use the graph panel so that they can see trends over time).
hello
so how is it
thanks
Is that a question? Can you give more details?
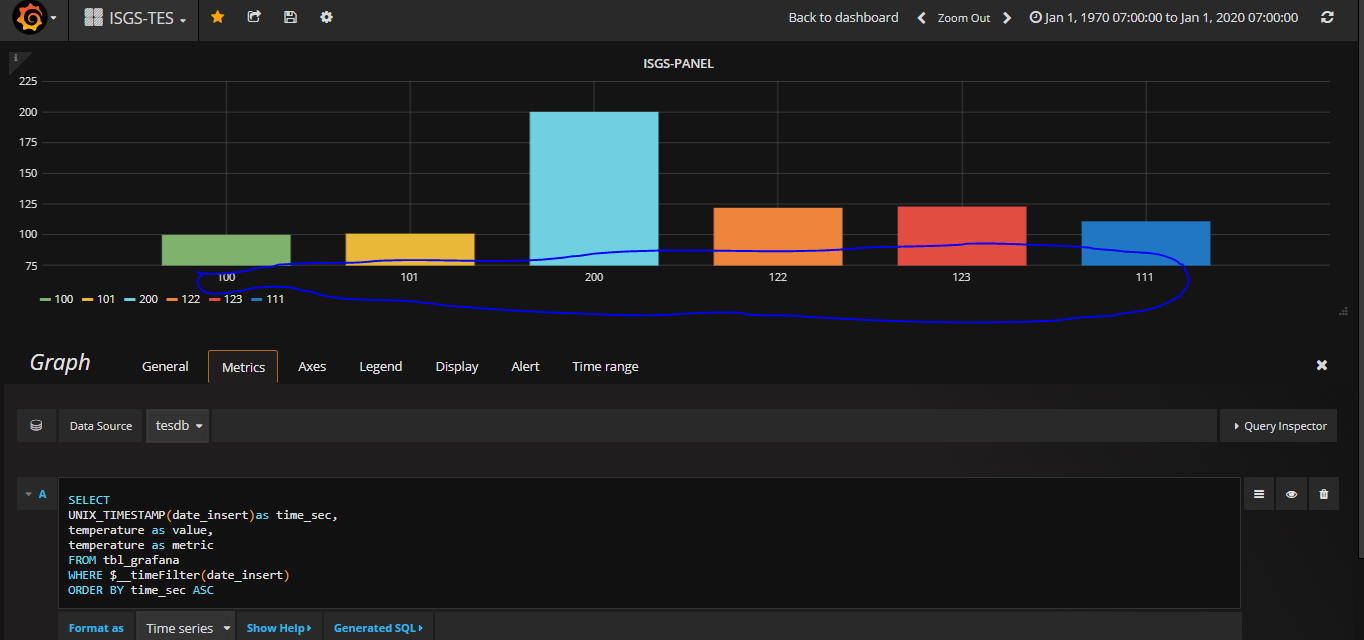
i dont have show date in graph
You have chosen Series mode. If you want dates, then choose Time mode instead.
series mode is time series
Can you show a screenshot. I don’t understand.

this blue underline dont have time series
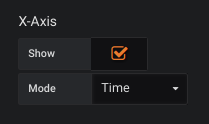
Are you sure? Should look like this on the Axes tab: