I hope you’re all doing well.
I have a question regarding a timeseries graph I’m working on.
Currently, the graph displays the months as “01/01,” “01/02,” etc.
However, I’d like to have the months displayed as their full names, like “January,” “February,” and so on.
Here’s the query I’m using:
SELECT
  $__timeGroupAlias(paid, 1h, 0),
  count AS "order"
  FROM
  (
  SELECT
	`o`.`type` AS type,
	CONCAT(DATE_FORMAT(`o`.`paid`, "%Y-%m"),'-01') AS paid,
    COUNT(`o`.`id`) AS count
	FROM
	  `order` o
	WHERE
	  AND  `o`.`paid` >= '2022-01-01'
	GROUP BY
	  YEAR(`o`.`paid`),
	  MONTH(`o`.`paid`)
  ) AS `order`
Has anyone else faced a similar issue or could offer some guidance on how to accomplish this?
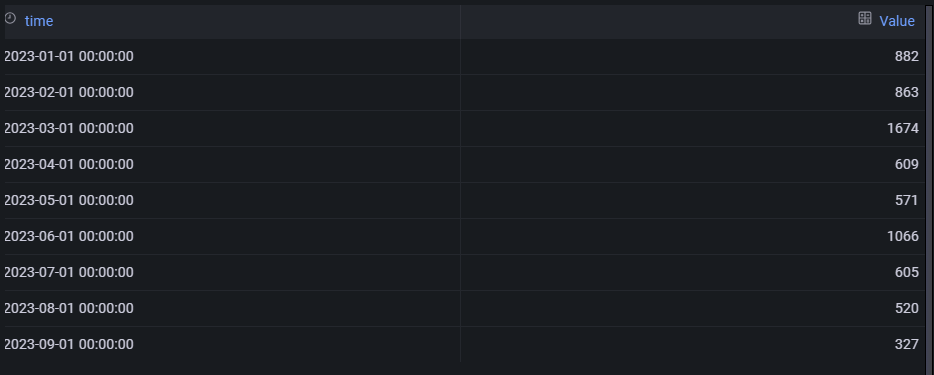
Except the above mentioned issue, I’ve encountered also another issue. As you can see in the graph although my table (see below) includes only the first day of each month, the graph is displaying dates between the months as well like 01/16, 15/02, 03/17 etc
time
Value
2023-01-01 00:00:00
100
2023-02-01 00:00:00
2
2023-03-01 00:00:00
963
2023-04-01 00:00:00
1593
2023-05-01 00:00:00
4
2023-06-01 00:00:00
57
2023-07-01 00:00:00
812
2023-08-01 00:00:00
1
2023-09-01 00:00:00
345
Any help or suggestions would be greatly appreciated.
So as you can see the actual data points with the dot are on the 1st of every month. the rest is just fill in data. that is just the way it does time series.
Dear @yosiasz thank you,
There is no way the graph to display only the first day of the month like 01/01, 01/02 …or just the name of the month ie Jan, Feb, etc.?
Hi @yosiasz thank you!
I managed to have a graph similar with what I wanted changing the time shift. I send it here for anyone who needs something like that.