-
Grafana 12.0.0 Zabbix plugin 5.2.1
-
We have a relatively fresh instance of Zabbix where we will use Grafana for visualisations.
I have strange situation with Text Metrics where I get reults using the explorer but not when I try to visualize them.
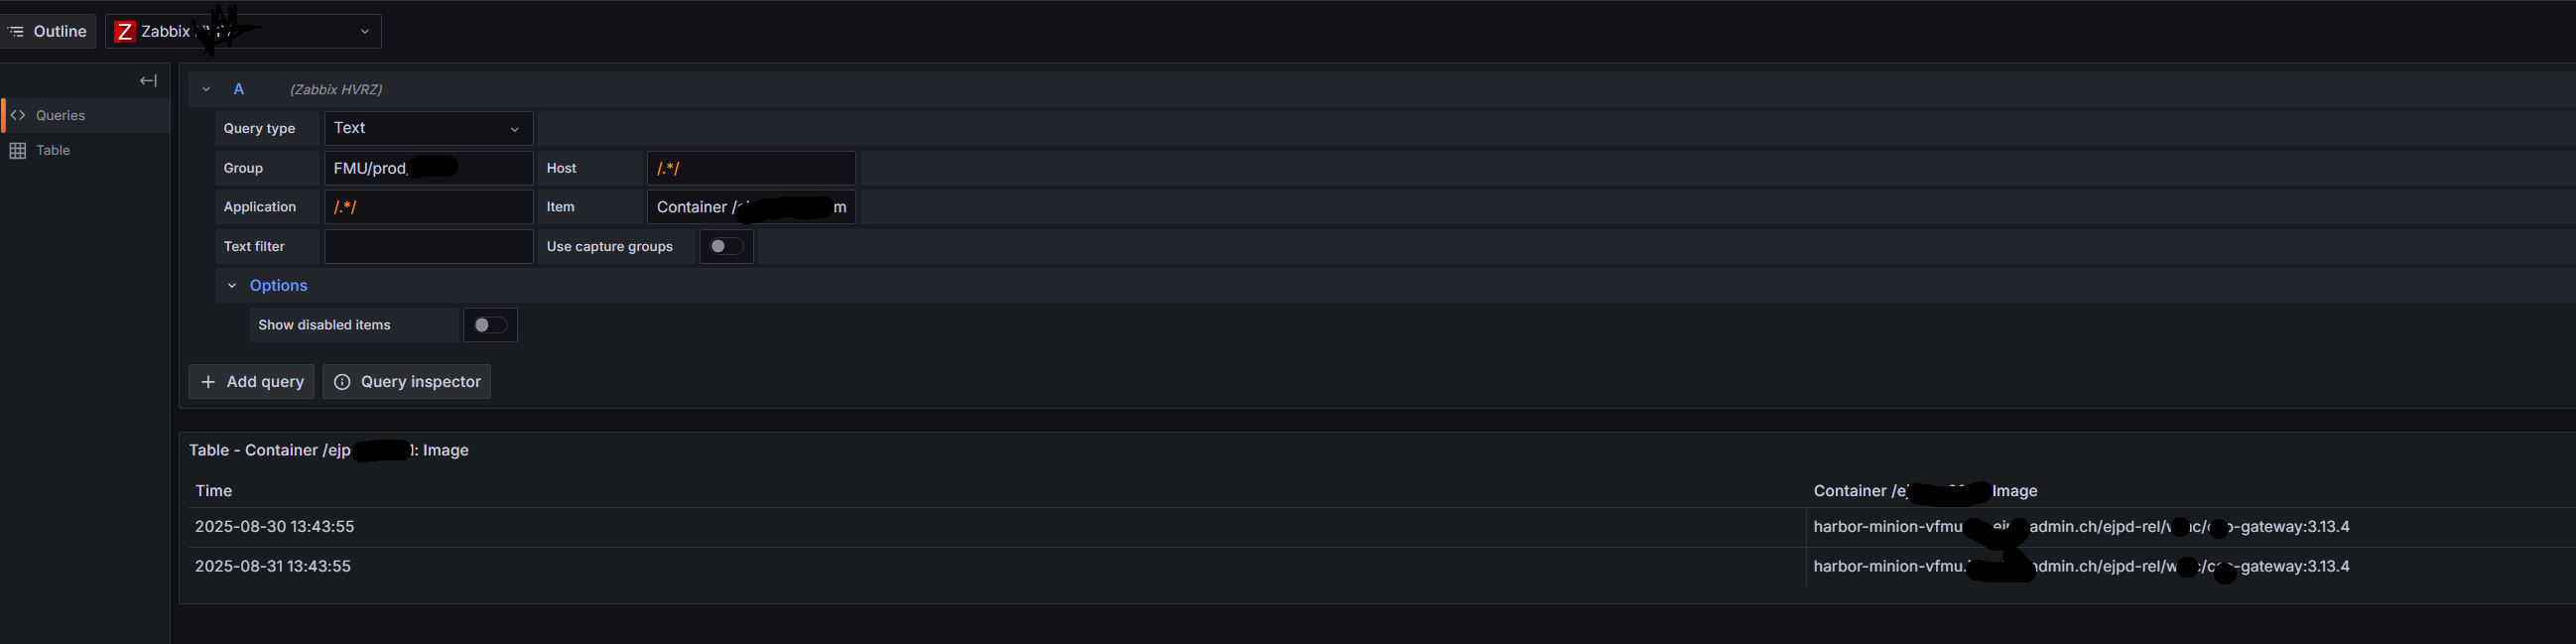
I have tried both the Stat and the Table panels.
The panel query returns no results. This is the case for all Text metrics so I suspect it could be something in our Zabbix set-up.The metric I am working on is the container image. I want to list the latest images for the dockerhost. This is a container metric.
I have figured out that I need to “force/override” the time period since the metric in is Zabbix only “created” daily.