Dear all
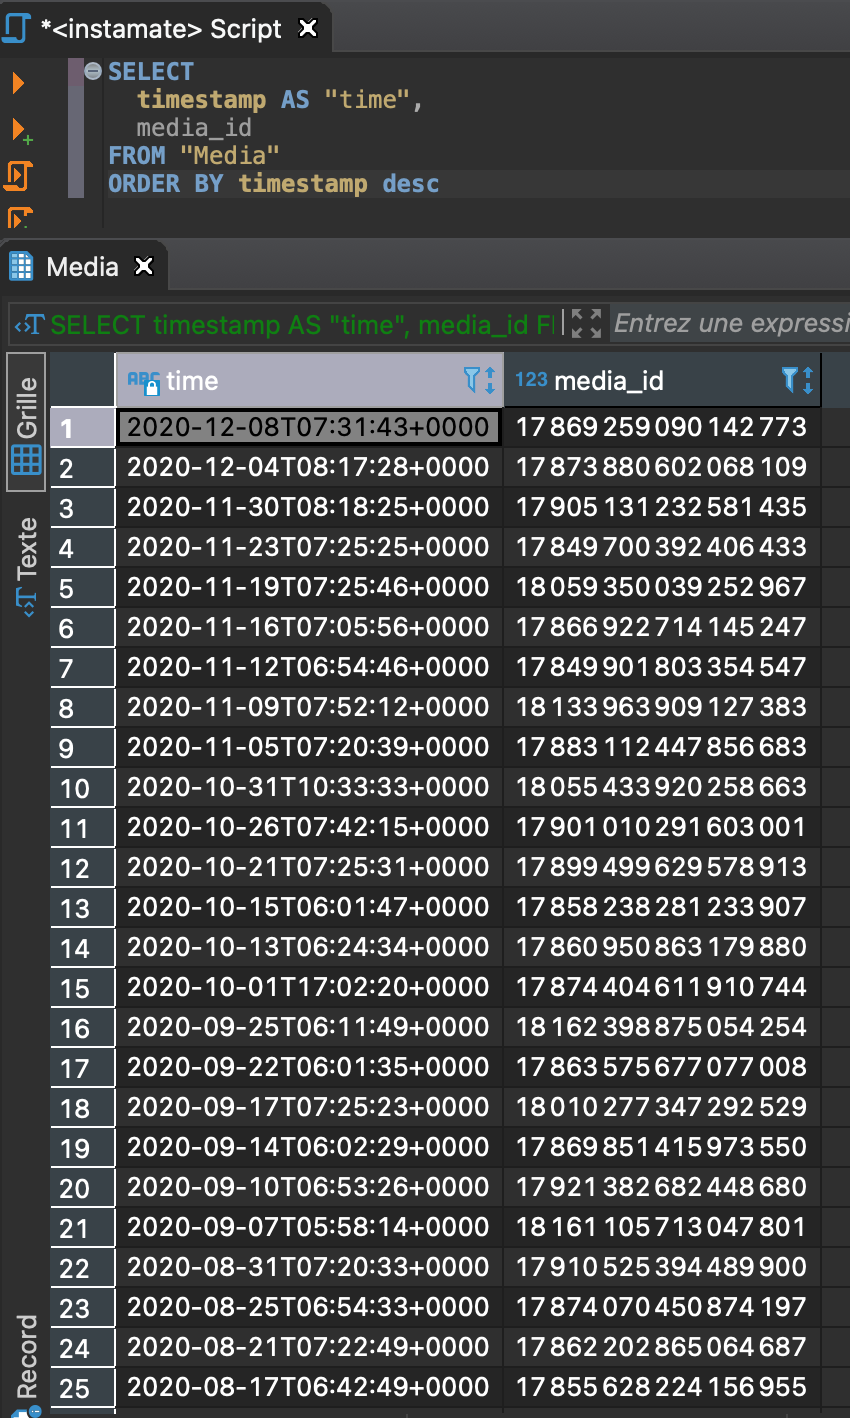
i have an issue that i don’t understand. I have int8 fields in a postgresql database. When i perform a request in DBeaver here is the result
I iperform the same request in grafana (visualisation in a table), i always get the media_id value minus 1
If i request the same values plus 1 the returned value is correct (value + 1) . +0 returns the wrong value, the minus 1 value
Try to put Min Interval: 1m in the Query options, instead of default 30m as in your image
Hi
Except if i missed something, it does not solve the issue
Is it the count(media) as count have different value?
Nope. The count is correct
Worse. If i only list IDs without timestamps values are +1 or -1 alternatively
Here are stored values :
And then the displayed values in Grafana :
So the first one is +2, the second -1, 3rd +1, etc …
I don’t understand why the value is affected
If both count is the same, means correct, it just the visualize, please try to click the time and make it desc in the gafana, not default as shown.
Also revert back with timestamp…
When i inspect the raw query, the resultset has already wrong values. Not sure but i understand then that the response from postgresql is then wrong ? If it’s the case then i don’t understand why the same request in DBeaver is correct
Auto reply with the solution :
The field is defined as a int8 in the database or a string (i tried both). When Grafana receives the value i don’t know why, the javascript command parseInt is applied and the returned value of parseInt(17869259090142773) is 17869259090142772
The solution in order to make it correct all the time is to add a Unit override and select string. Then i have the correct value.
I guess that a bigint lib is missing in Grafana ?
I suggest, please create Bug report in the grafana github to inform the developer about this…