-
I am using Grafana version v12.2.0
-
I am trying to build a dashboard that got several visualizations where time range need to be different for each visualization (In other words ignore the time range selection on the main dashboard)
-
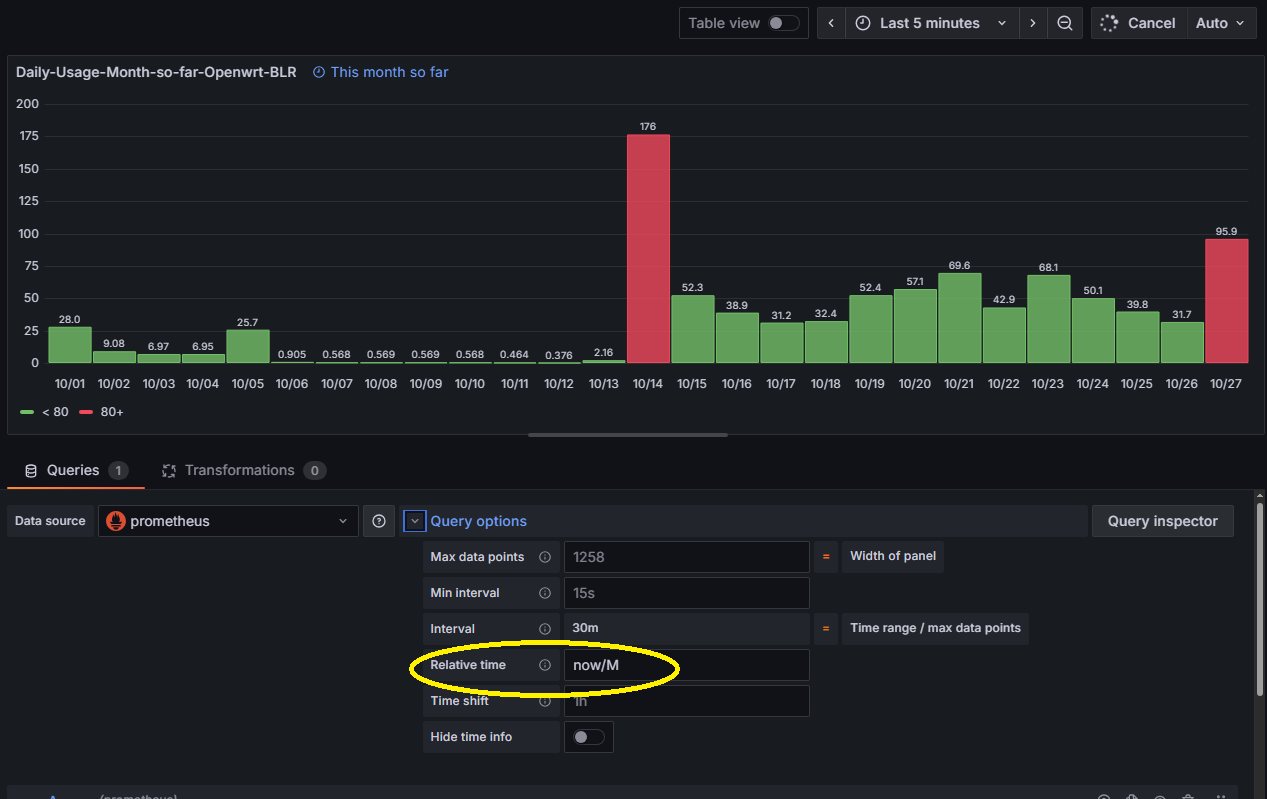
For example,

In above Dashboard, first visualization I want to set the time range as “This month so far” and second one as “This year so far”
Is this doable?