Hello,
Just wondering if there is a way to choose a default time range for a Dashboard. Right now, every time I select a given dashboard, it always displays the last 6 hours, but I would like it to display the last 7 days by default. I’m currently forced to let the dashboard load with the last 6 hours of data, and then manually change to Last 7 Days in the Time Selector.
3 Likes
For anyone still wondering, it is possible to override the “default” time selection by editing the Dashboard’s JSON in Dashboard settings. Changing the value there will serve as a permanent default while still allowing use of the Time Range selection tool.
2 Likes
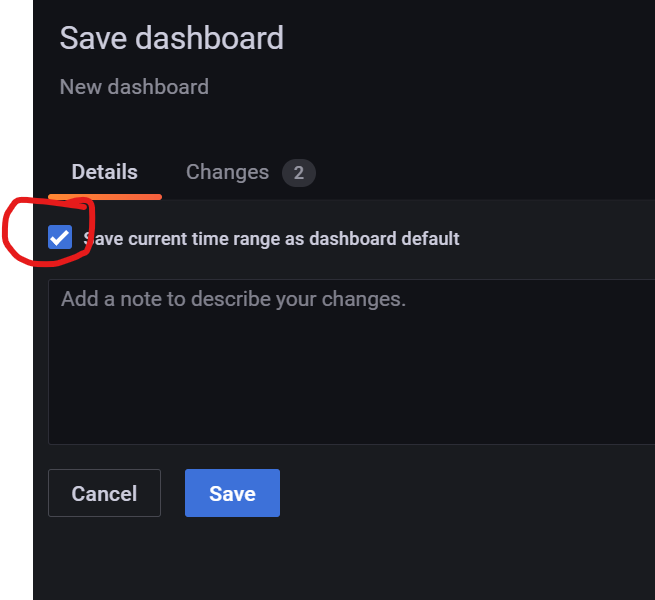
A simpler way to save the default time range is to set the range, click save and make sure to toggle “Save current time range” ![]()

14 Likes
It does not work 
2 Likes
it does work. Save and then refresh your browser.!!! 
I agree - there is no toggle for this on my save window. V7.0.3
1 Like
The toggle will appear only if there is change in the ‘time range’. Otherwise it will not come.
Deb
After a period where this feature seemingly did not work I decided to be analytical. I had dashboards that seemed to change their time ranges in an almost random way. I checked the JSON for the dashboards and also their URLs. Then I found what I had done, and it all made sense. A couple of the six dashboards had the box “include current time range” ticked in the Dashboard Links section. Whenever these dashboards had their time ranges altered then the very next dashboard would get that time range. If I looked at the URL then is was there.- clear as day. So, the answer is to make sure that none of the dashboards in the group have this box checked and all of the dashboards will use the JSON values. If you change the time range and then save the dashboard then you will be asked if you want to update the time too. Ticking the box tells Grafana that you want the time range as part of the URL and, if it is, anarchy breaks out as they will all get that time range until you change it again.
1 : Apply the time range you want
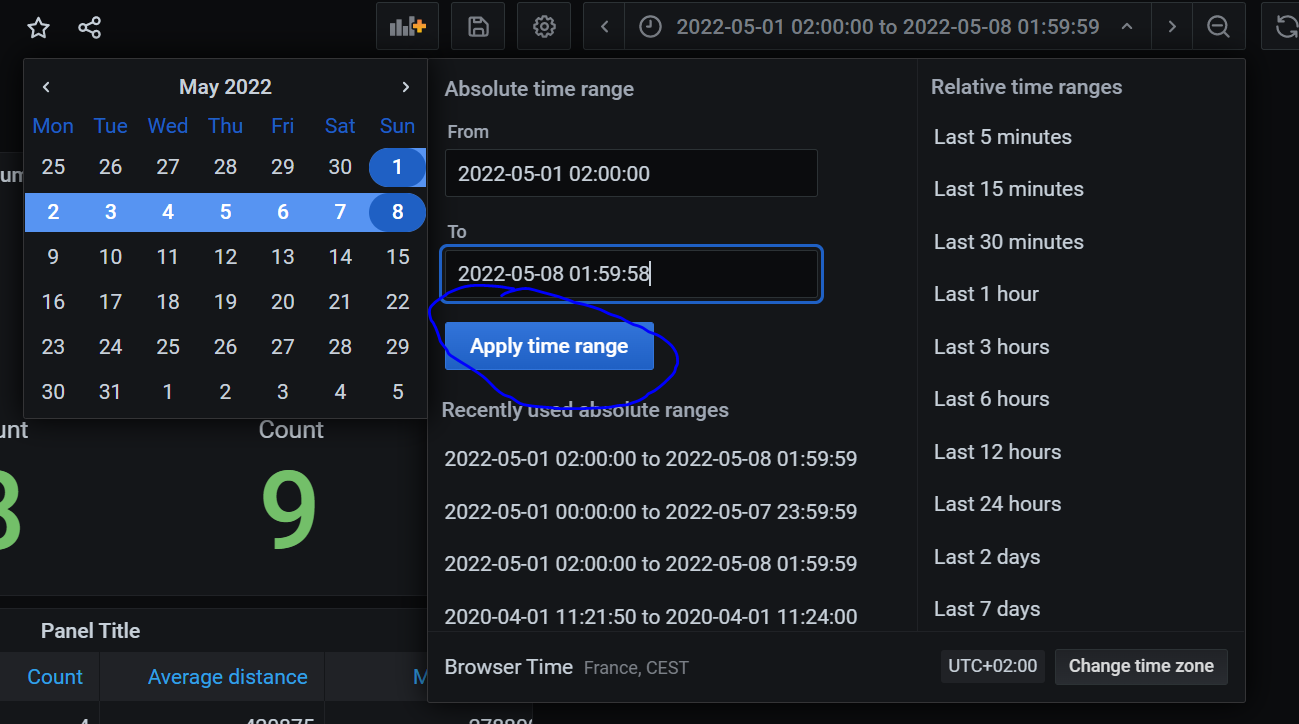
2 : Save and check this box (only appears if you made a change to the time range)

2 Likes
Just logged into the forum to say THANK YOU!
Hi, I updated Grafana to the v11.5.2. Since then, I can only set relative time range (eg : last week, previous year, etc.) as default. I can no longer set absolute time range as default, (from the 13th of may 2024 to the 3rd of september 2024 for example). Am I the only one having this issue ? Is there any solution ?
Same, this was driving me crazy, I never saw the tick box in the save dialog. This should really be a dialog on save “we noticed that you changed the time range, do you want to make this the default”