Hi,
I configured a PostgreSQL data source over PDC while ago on Grafana Cloud (single user, no teams, shoud be admin everytwhere). A few days ago, the dashboard I built on it started showing errors “Access denied to datasource”.
I tried creating a new PG data source over a new PDC on a different server, and the same problem appears: permission errors when querying the data source in dashboard or Explore, but everything fine in Alerting. I couldn’t find any other post reporting the same situation: is this a problem with my account?
I guess there was some RBAC update, which is causing a problem. Report it with those traceids to your Grafana Cloud support,so they can check it.
Login into your Grafana Cloud instance and then visit https://<grafana-cloud-instance-url>/api/access-control/user/permissions and check if you have all datasources.* permissions.
@jangaraj You recently closed my post and said to use this as an existing topic, however this is not the same as my post.
I am new to the Grafana forums, Can you guide me on how to proceed next?
I don’t think this is the same issue and would like to open another topic again. (In the grafana pdc tab, i have 0 clients connected even though the grafana pdc agent is still running. Thus i don’t think this is the same.)
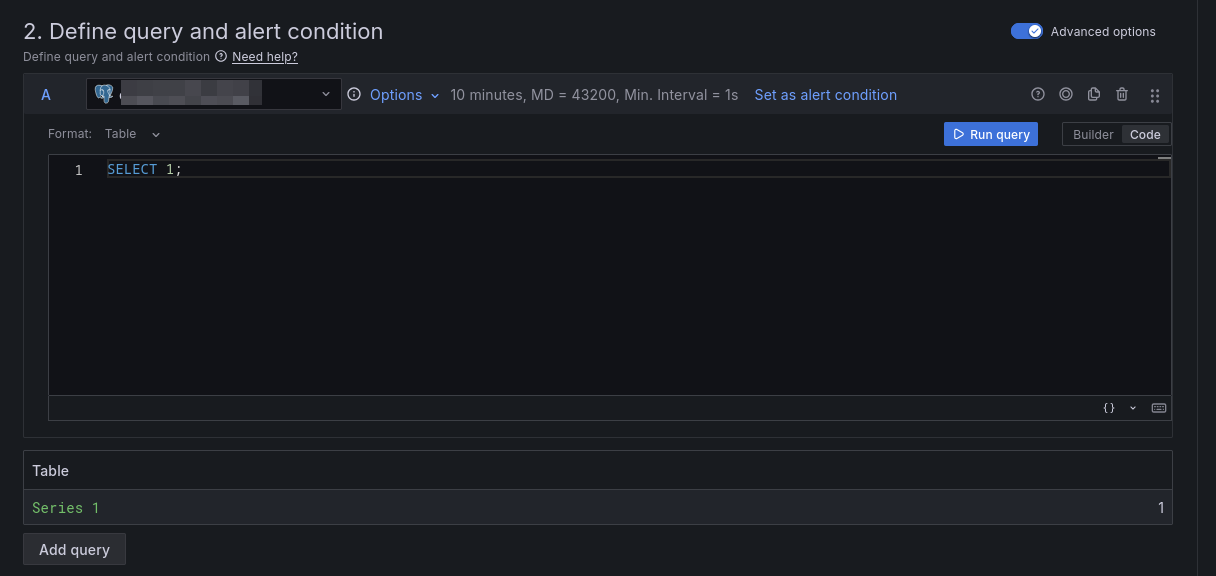
I don’t really know how to read the API’s response, but I can see multiple “datasources:*” as well as “datasources:uid:<uid of the data source>”. I blurred the data source ids in the screen capture below, no idea if this is sensitive or not.