grafana-oss v.12.0.0-12.0.1
alertmanager v. 0.28.0
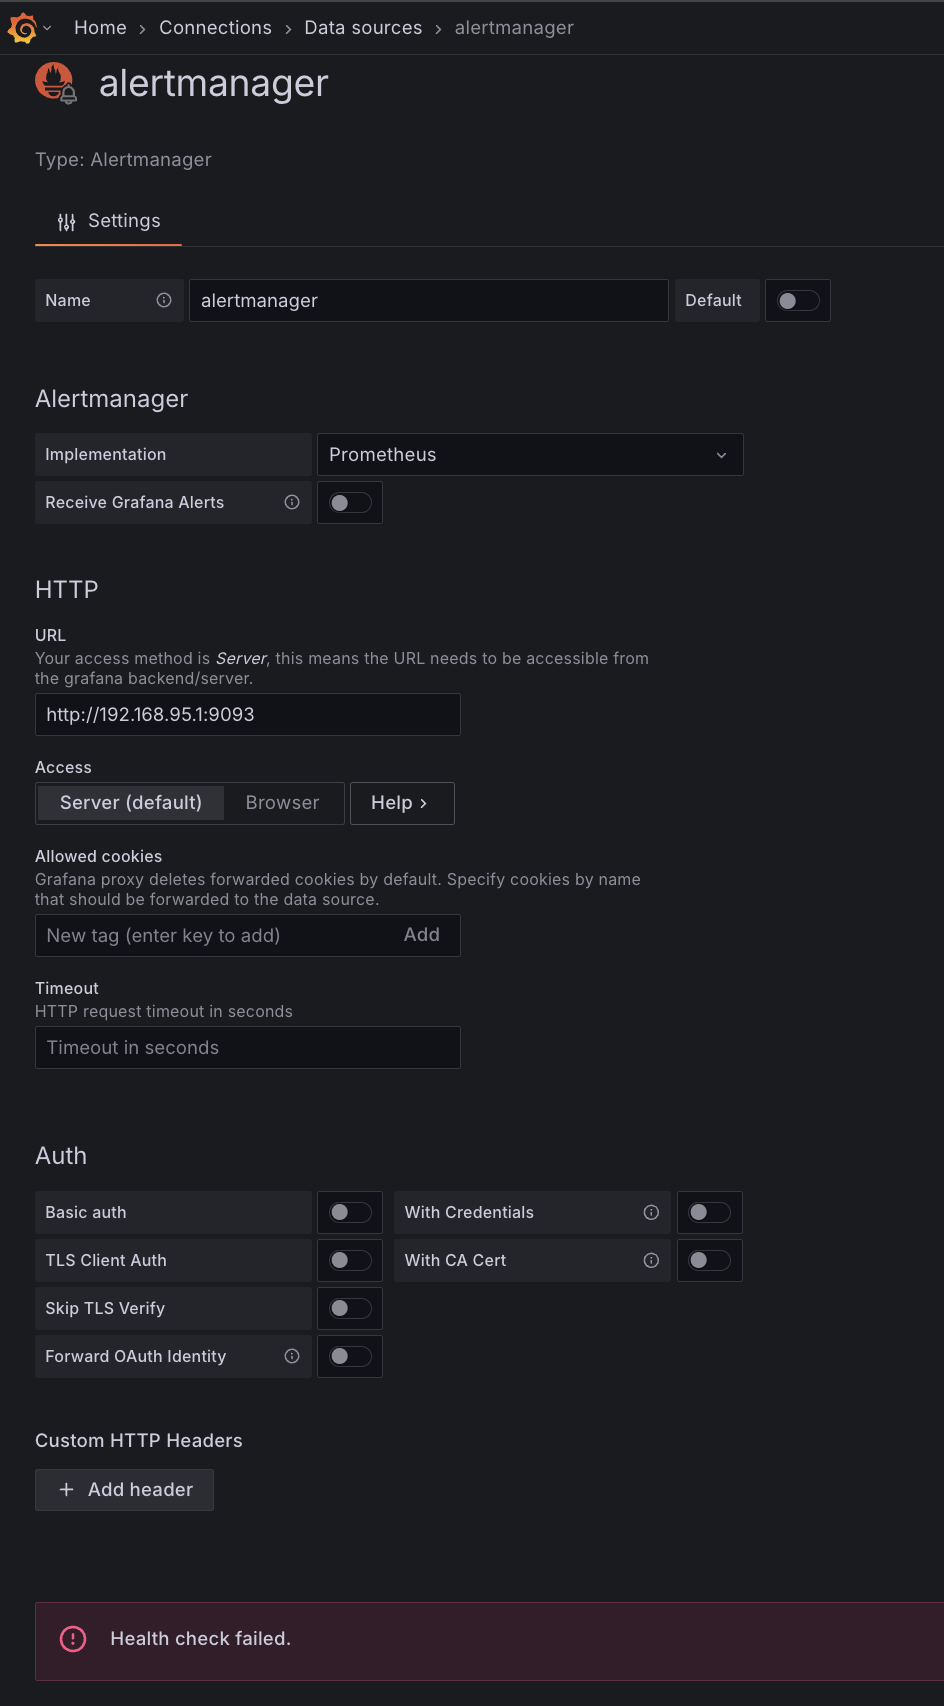
I’m trying to add a datasource with type Alertmanager (which is built into Grafana).
The user has admin and grafanaadmin rights. This is a user with ID:1.
I’m using the instructions from Alertmanager data source | Grafana documentation
The screenshot shows exactly how I’m adding it.
Grafana is running in a Docker container. The Alertmanager is accessible from the same Docker container if i try via curl.
In the web interface response, I get an error:
“Health check failed.”

The logs of Grafana at this time contain such entries:
logger=accesscontrol t=2025-05-25T10:45:05.806844824Z level=debug msg="Evaluating permissions" id=user:1 orgID=1 permissions="action:datasources:query scopes:"
logger=datasources t=2025-05-25T10:45:05.806865002Z level=debug msg="Querying for data source via SQL store" uid=aemw00vrohpmoe orgId=1
logger=datasource t=2025-05-25T10:45:05.807389063Z level=debug msg="Applying default URL parsing for this data source type" type=alertmanager url=http://192.168.95.1:9093
logger=data-proxy-log t=2025-05-25T10:45:05.807425882Z level=debug msg="plugin route is covered by RBAC, user doesn't have access" route=/api/datasources/proxy/uid/aemw00vrohpmoe/alertmanager/api/v2/status action=alert.notifications.external:read path=alertmanager/api/v2/status method=GET
logger=context userId=1 orgId=1 uname=dimetrius t=2025-05-25T10:45:05.807497017Z level=info msg="Request Completed" method=GET path=/api/datasources/proxy/uid/aemw00vrohpmoe/alertmanager/api/v2/status status=403 remote_addr=xxx.87.xxx.6 time_ms=2 duration=2.764074ms size=47 referer=https://grafana.xxx.xxx/connections/datasources/edit/aemw00vrohpmoe handler=/api/datasources/proxy/uid/:uid/* status_source=server
I believe the key log entry is
msg="plugin route is covered by RBAC, user doesn't have access"
It seems like this shouldn’t be happening in the grafana-oss.