Dashboard variable for bucket in flux

writing a dashboard, where I wish to select a bucket with similar structure

  1. I have seen the v.bucket means anything what is not documented. Didn’t understand what bucket it is, but probably it is the telegraf/autogen for me
  2. created a dashboard variable bucket using query buckets(). But flux query results in an error. Is it a bug or I am doing anything wrong?
from(bucket: "${bucket}")
  |> range(start: v.timeRangeStart, stop: v.timeRangeStop)
...
  |> aggregateWindow(every: v.windowPeriod, fn: last, createEmpty: false)

error is like this:

not found: failed to initialize execute state: could not find bucket "my-selected-bucket-name"

hello this is a good method to change bucket from grafana variable,
But it’s look like “my-selected-bucket-name” does not exist in influx

what value are in your $bucket ?
did you go in influxdb to see what are already existing bucket ?

you can explore you schema with flux

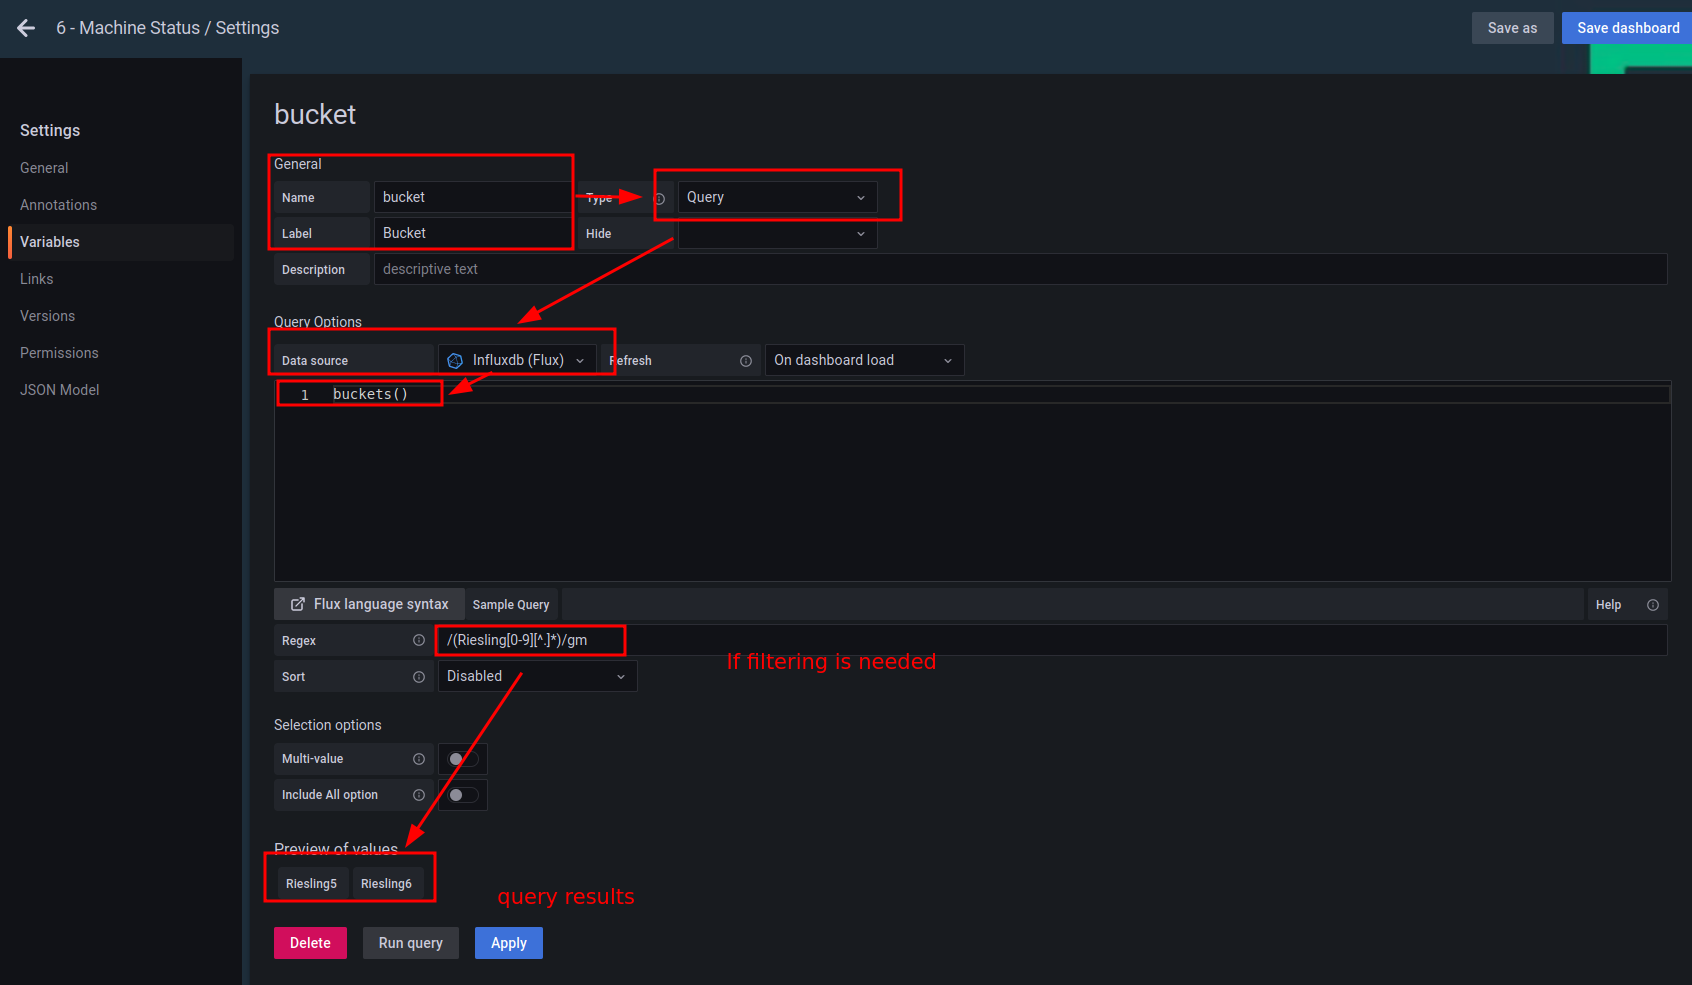
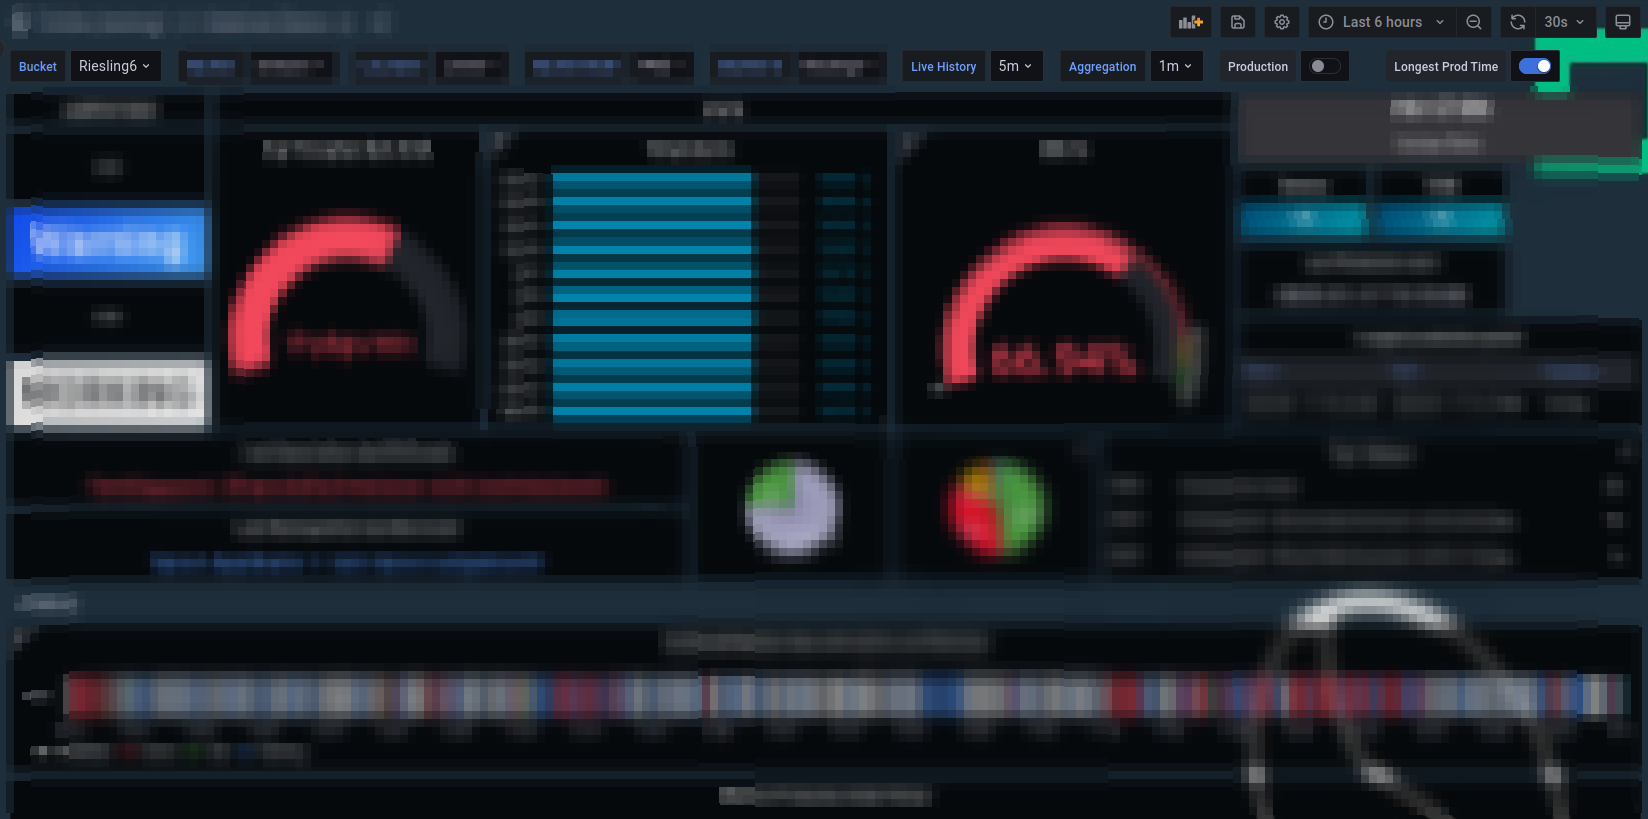
the bucket exists, the dashboard variable named “bucket” has a query “buckets()”, in the variable editing page are buckets listed under “Preview ov values”, and also in the “bucket” dropdown in the dashboard.

1 Like

use query inspector to get the exact query string send to influxdb,


and run it in influxdb UI query editor to fix your query

Hi @vilinski,

Thanks for opening this post.

I think here v.bucket needs to be adjusted as only

from(bucket: "telegraf")

Then it should work.

thanks for tipps, but not quit what I want

my query also works for sure, if I set it’s name literally, like from(bucket: "telegraf") or from(bucket: "existing-bucket"),
but I need a variable on the place, like from(bucket: "${myselectedbucketnamevariable}), to switch between buckets on the same host. So is implemented our “multitenancy” there. But it doesn’t work because of the error mentioned above
Query inspector shows the query just right

UPDATE, grafana dashboard works only if I select “telegraf” bucket
Could it be because of rights of other buckets? Why they are listed then?
Actually the token of this datasource is administrator’s one, if noone played with my deployment

bucket = ${clowns:doublequote}

from(bucket: bucket)
  |> range(start: v.timeRangeStart, stop: v.timeRangeStop)

1 Like

didn’t know about this variant ${bucket:doublequote}, but no, still the same error unless I select “telegraf” in the bucket variable dropdown, which is useless for my case

So most probably different tokens per bucket? Please post grafana log

And the flux query

I can’t get grafana logs, because it managed not by me.
But looks for me too like there is some token problem. Just why the buckets are listed then…

1 Like

who is it managed by? ask them

You need to define a bucket variable in dashboard like this:

In grafana panel query:

bucket = "$bucket"
// other variables...

from(bucket: bucket)
  |> range(start: v.timeRangeStart, stop: v.timeRangeStop)
  |> filter(fn: (r) => r["qual"] == "good")
  |> filter(fn: (r) => r["host"] == host)
  |> filter(fn: (r) =>  r["_measurement"] =~ measurement_warning_regexp )

I can select a bucket to update my dashboard queries.

thanks, this is actually exactly what I did, but it didn’t work

The actual problem was, as I mentioned in my previous comment, some bug or token misconfiguration in the influxdb. I have just dropped this bucket and recreated it with the token I have again.

The topic is closed. Thanks for your answers.