Hello guys, I’m very new to Grafana and I have a very rookie question. I did the Node exporter , Prometheus and Grafana installation, all without any error in my Ubuntu machine.
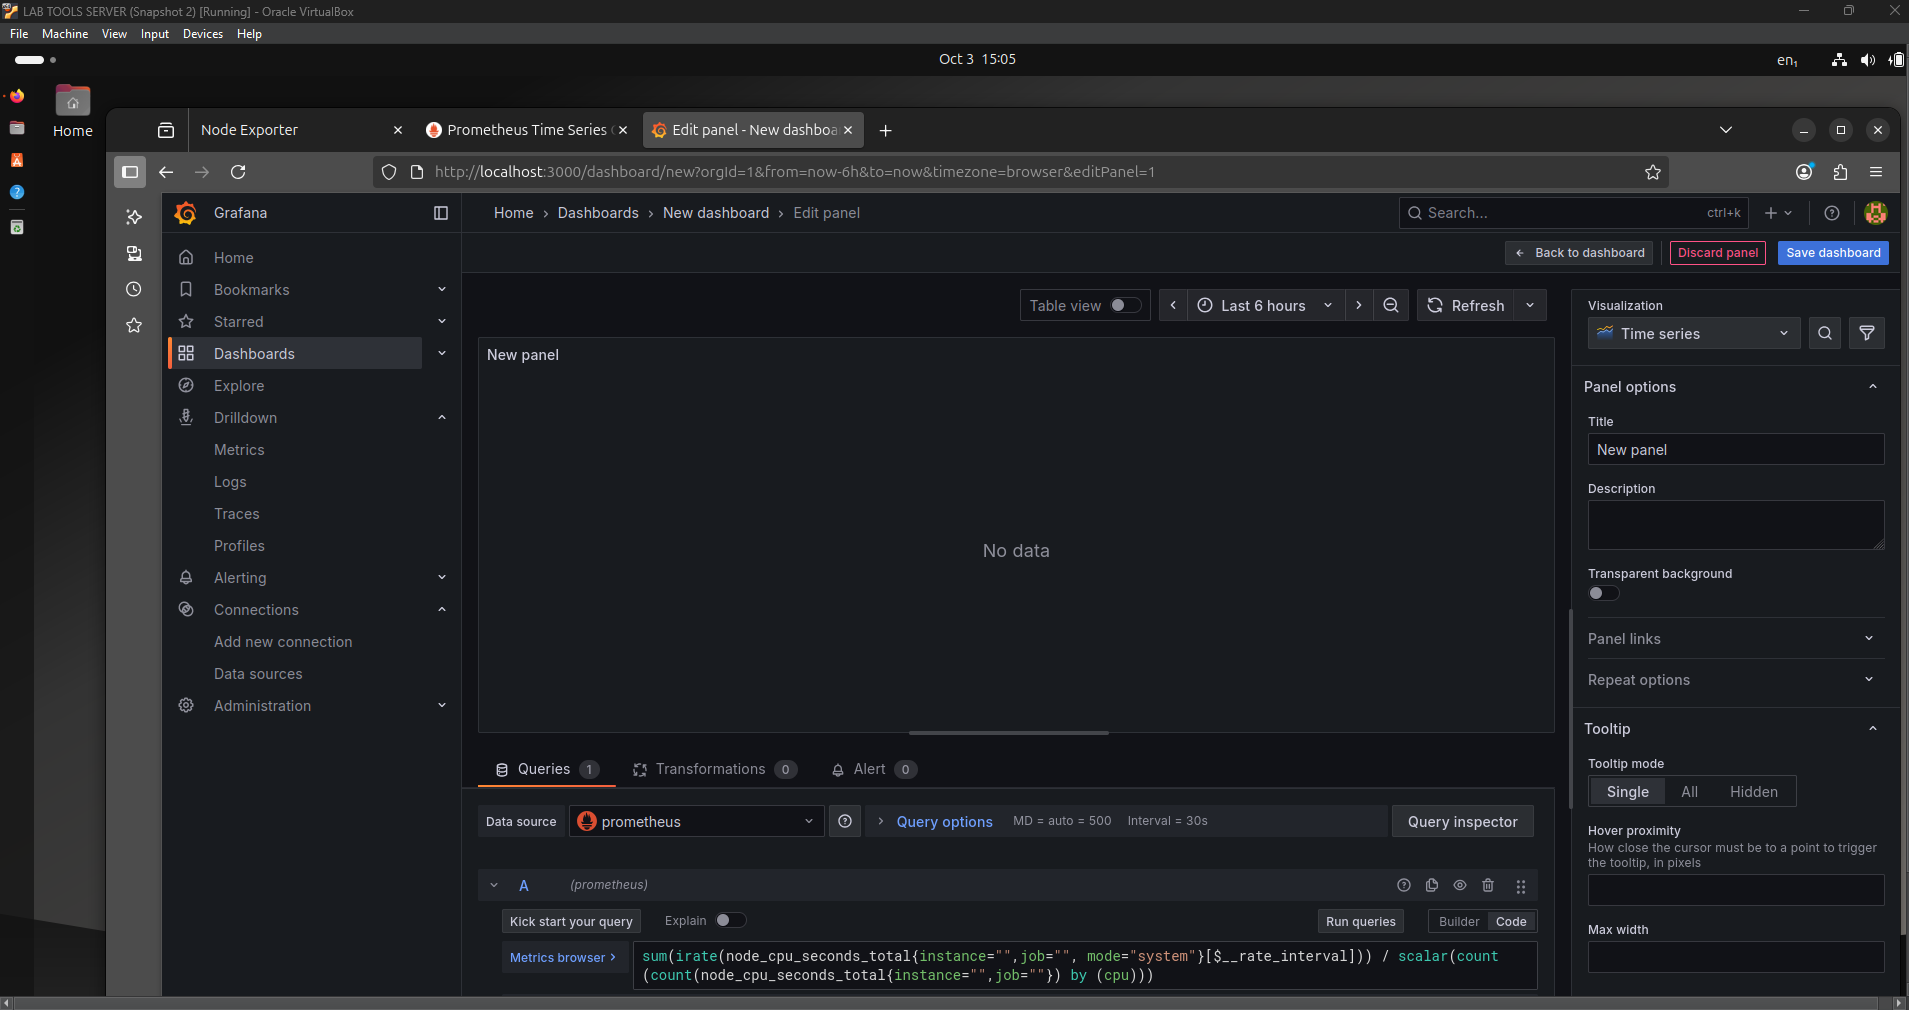
My issue is, when I try to run a simple query, it always return NO DATA. I checked all services and they are all up and running. I really don’t know what else could it be. Please help me.
Hi, can you confirm that node_cpu_seconds_total return any data by itself (without any label selectors, ran e.g. in Explore view). If not, the metrics are not coming into Prometheus instance.
Another thing is the query you’ve executed. When you write node_cpu_seconds_total{instance=””, job=””} you ask for all series of node_cpu_seconds_total metric that do not have instance and do not have job labels (=”” means give me empty string and prometheus interprets that as the label doesn’t exist on the series). As far as I know, prometheus standars require instance and job in every time series. Try selecting some instance and some job (or don’t write those in selector at all and see what happens, though it might kill your prometheus instance  ). When you write the query, Grafana will suggest come possible values to the label selectors.