-
What Grafana version and what operating system are you using?
Grafana 9.4.3 on AWS Linux -
What are you trying to achieve?
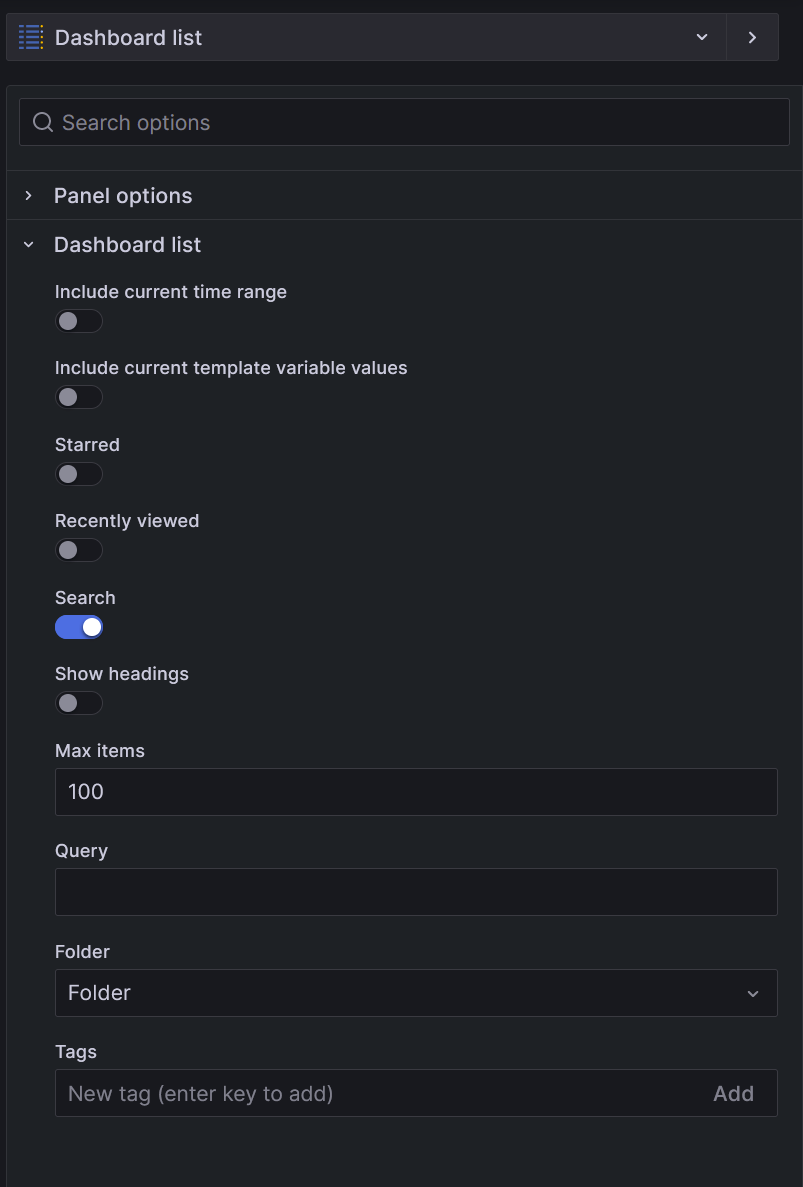
Using the Dashboard List panel, I want to filter the dashboards that are displayed. I have more than will neatly fit into a single list. For example, I want a list of the 10 panels that are start with the letters A-H, and another Dashboard List panel list that displays the other 10 panels that start with the letters I-Z. -
How are you trying to achieve it?
Using the Dashboard List’s Query field. -
What happened?
The only success I had was by entering a string that results in a case-insensitive search across the dashboard titles. -
What did you expect to happen?
I want to use do more than a simple string search. For example, use a regex that would to select ranges of dashboard titles, e.g, search for those that start with A-H. -
Can you copy/paste the configuration(s) you have problems with?
n/a -
Did you receive any errors in the Grafana UI or in related logs? If so, please tell us exactly what they were.
The Dashlist just goes blank when anything other than a simple string is entered. -
Did you follow any online instructions? If so, what is the URL?
Dashboard list | Grafana documentation
What I think I need is an example of how to configure a Query. The doc simply says, “Enter the query you want to search by.” What style/query/type/language of a query is expected?
I’m looking for the same information. The documentation doesn’t specify the format of the query anywhere. I tried some different strings and wildcards and nothing seems to produce any results.
What I’m trying to do is list all dashboards in a particular folder
@oliverschenk, what @jangaraj pointed out is that you can list all the dashboards in a folder by selecting the folder in the settings. Based on what you asked, that should work for you.
What I was trying to do was a bit different: to display only some of the panels in a specified folder. It seems that the Query field only does simple string filtering, and I needed ranges/regex capabilities.
I think you are mixing terms dashboard/panel incorrectly. You will have higher chance for answer if you use proper terms.
Of course dashboard list panel type can’t search panels. It is only for dashboards (not panels).
Oops. You are correct, @jangaraj. Should have written, “…display only some of the dashboards in a specified folder…”
That search uses dashboard search API under the hood. IMHO it doesn’t support any regexp queries.
Hi,
is there a solution?
I’m facing the same problem.
Thanks.
you could leverage querying the grafana.db sqlite file if your grafana is installed on prem
How does this work with the Dashboard List-panel?
That’s unclear to me …
Thanks for the hint.
The querying of grafana.db approach is unrelated to Dashboard List. It just allows one to create a more powerful way of querying the dashboard and panels world.
the OP was talking about searching panels and was conflating terminologies: dashboard and panels. Dashboard list does not seem to allow for panel and more complex querying.
Yes, my question was realated to the query-option in the dashboard list-panel.
So I need a more complex seach for Dashboards.
But I changed my provisioning to added more tags to my dashboards.
Thus, the seach works better…