I want to visualize the count when a device entered the Interrupted state per day.
What works
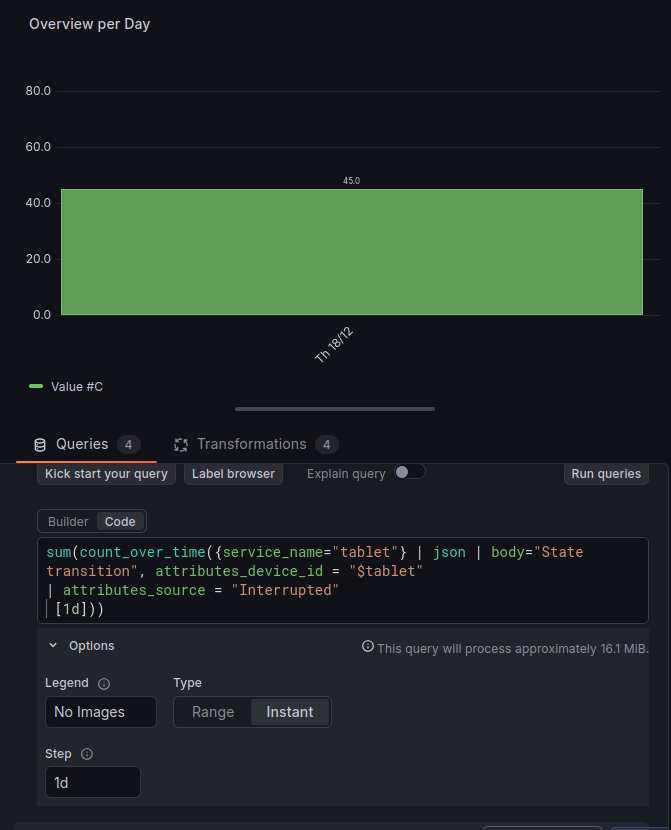
To get the total count over a specific time window, I use an instant query this correctly returns a single value (eg 45) for the selected time range.
sum(count_over_time({service_name="tablet"} | json | body="State transition", attributes_device_id = "$tablet"
| attributes_source = "Interrupted"
 [$__range]))
type: Instant
result: 45 (correct)
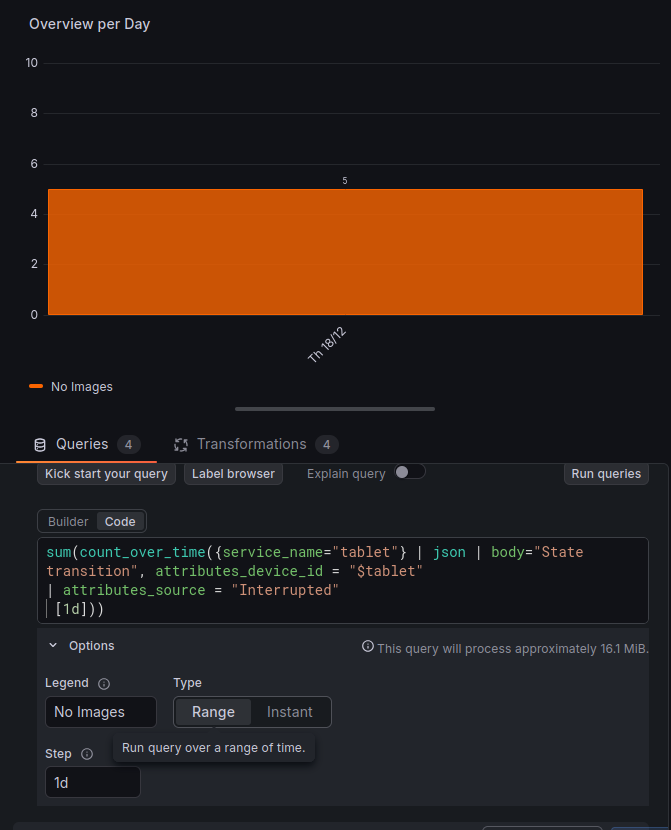
The problem: Range query
When I try to break this down by day by switching to a Range Query and setting the interval to 1d. It shows the incorrect (too low) result. Even when the dashboard time filter is set to exactly 1d, the range and instant query show different results (see screenshots)
sum(count_over_time({service_name="tablet"} | json | body="State transition", attributes_device_id = "$tablet"
| attributes_source = "Interrupted"
 [1d]))
type: Range with Step 1d
result: 5
Setting the time filter on 1 day and type on `instant` gives the correct result of 45. The of course cannot be used with a time filter over multiple days as I want a result per day.
If I set the range on $__auto , type Range and Step auto it shows all the values, but not the sum per day because this is not mentioned. The result here is the sum of all these values. If I set the min interval in the query options on 1d , it also gives 5 (incorrect result).

How do I format the query to show the total count of Interrupted states per day?