Hi all
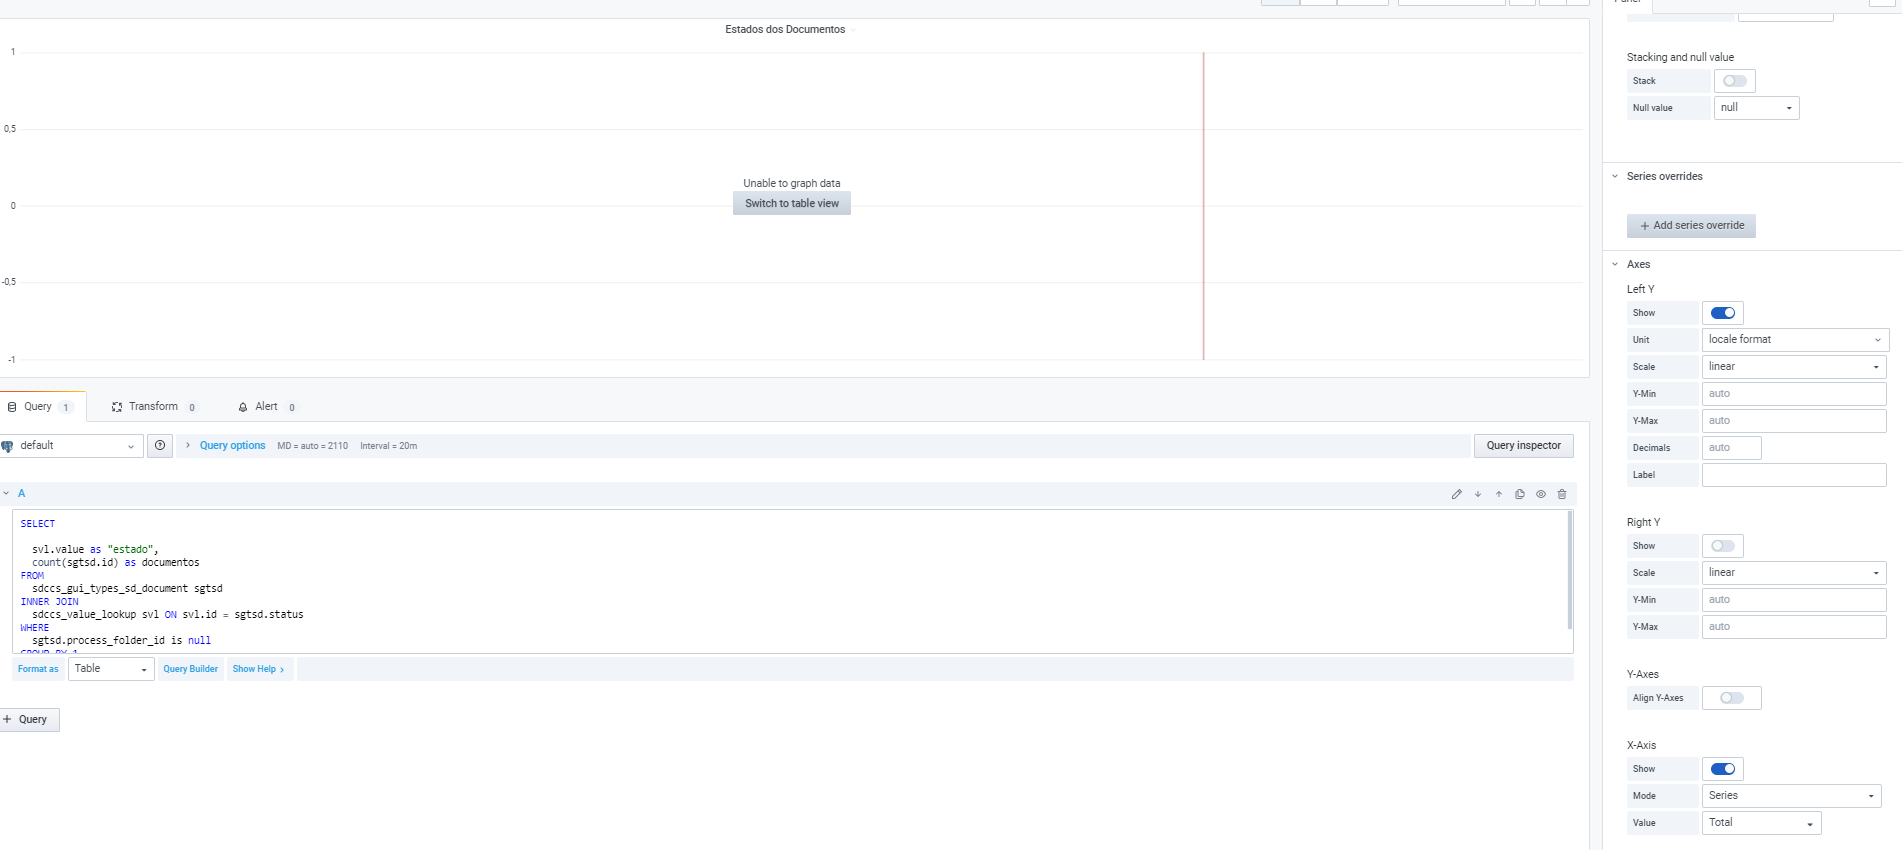
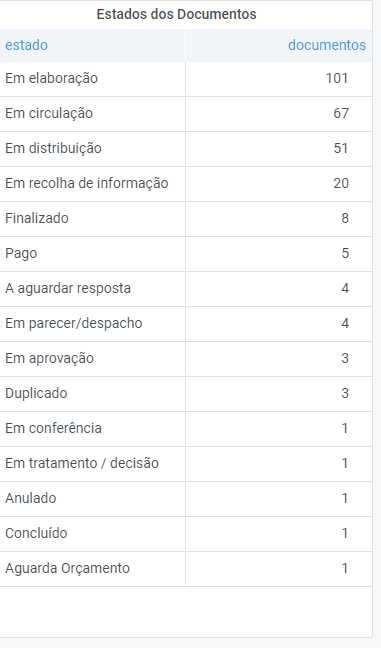
I’m beggining in Grafana, I need to convert a list from data source of postgres to a graph bars. When I change visualization loose the description of each value.
My query is like this.
SELECT
svl.value as “estado”,
count(sgtsd.id) as documentos
FROM
sdccs_gui_types_sd_document sgtsd
INNER JOIN
sdccs_value_lookup svl ON svl.id = sgtsd.status
WHERE
sgtsd.process_folder_id is null
GROUP BY 1
ORDER BY 2 DESC
And when I change for gauge bars, I loose the specifications of each column, only have docments text, but I need to watch “estados” related to documentos value!

Thanks in advance