Hi @thibaultnocchi
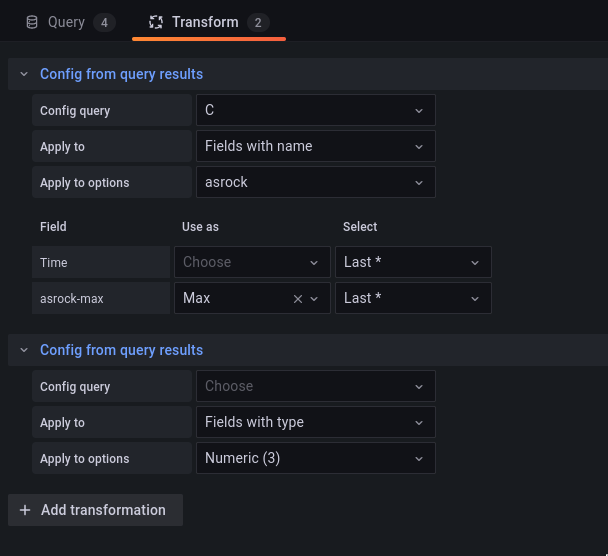
The config from query results transform is brand new and still in beta.
Can you view this dashboard on our public sandbox? It is a demo dashboard that includes 5 panels all using that new transform.
I’ve included the dashboard JSON below–I don’t think you can access that. Go to your instance and add the TestData DB datasource. Keep the name as the default TestData DB. Save the datasource. Then import the JSON below. That should give you five working examples of that feature  :
:
{
"annotations": {
"list": [
{
"builtIn": 1,
"datasource": "-- Grafana --",
"enable": true,
"hide": true,
"iconColor": "rgba(0, 211, 255, 1)",
"name": "Annotations & Alerts",
"target": {
"limit": 100,
"matchAny": false,
"tags": [],
"type": "dashboard"
},
"type": "dashboard"
}
]
},
"description": "",
"editable": true,
"gnetId": null,
"graphTooltip": 0,
"id": 2,
"links": [],
"panels": [
{
"datasource": "TestData DB",
"fieldConfig": {
"defaults": {
"color": {
"mode": "palette-classic"
},
"custom": {
"axisLabel": "",
"axisPlacement": "auto",
"barAlignment": 0,
"drawStyle": "line",
"fillOpacity": 0,
"gradientMode": "none",
"hideFrom": {
"legend": false,
"tooltip": false,
"viz": false
},
"lineInterpolation": "linear",
"lineWidth": 1,
"pointSize": 5,
"scaleDistribution": {
"type": "linear"
},
"showPoints": "auto",
"spanNulls": false,
"stacking": {
"group": "A",
"mode": "none"
},
"thresholdsStyle": {
"mode": "line"
}
},
"mappings": [],
"thresholds": {
"mode": "absolute",
"steps": [
{
"color": "green",
"value": null
},
{
"color": "red",
"value": 80
}
]
}
},
"overrides": []
},
"gridPos": {
"h": 9,
"w": 12,
"x": 0,
"y": 0
},
"id": 2,
"options": {
"legend": {
"calcs": [],
"displayMode": "list",
"placement": "bottom"
},
"tooltip": {
"mode": "single"
}
},
"targets": [
{
"hide": false,
"max": 100,
"min": 1,
"refId": "A",
"scenarioId": "random_walk",
"startValue": 50
},
{
"alias": "",
"csvContent": "min,max,threshold1\n1000,1000,8000\n0,100,80\n\n",
"refId": "config",
"scenarioId": "csv_content"
}
],
"title": "Min, max, threshold from separate query",
"transformations": [
{
"id": "configFromData",
"options": {
"configRefId": "config",
"mappings": []
}
}
],
"type": "timeseries"
},
{
"datasource": "TestData DB",
"fieldConfig": {
"defaults": {
"color": {
"mode": "thresholds"
},
"custom": {
"align": "left",
"displayMode": "auto"
},
"mappings": [],
"thresholds": {
"mode": "absolute",
"steps": [
{
"color": "green",
"value": null
},
{
"color": "red",
"value": 80
}
]
}
},
"overrides": [
{
"matcher": {
"id": "byName",
"options": "SensorA"
},
"properties": [
{
"id": "custom.displayMode",
"value": "color-text"
}
]
}
]
},
"gridPos": {
"h": 9,
"w": 12,
"x": 12,
"y": 0
},
"id": 5,
"options": {
"showHeader": true
},
"pluginVersion": "8.1.2",
"targets": [
{
"csvContent": "Name, Value, SensorA, MyUnit, MyColor\nGoogle, 10, 50, km/h, blue\nGoogle, 100, 100,km/h, orange\n",
"hide": false,
"refId": "A",
"scenarioId": "csv_content"
}
],
"title": "Custom mappings and apply to self",
"transformations": [
{
"id": "configFromData",
"options": {
"applyTo": {
"id": "byName",
"options": "SensorA"
},
"applyToConfig": true,
"configRefId": "A",
"mappings": [
{
"configProperty": "unit",
"fieldName": "MyUnit",
"handlerKey": "unit"
},
{
"fieldName": "MyColor",
"handlerKey": "color"
}
]
}
}
],
"type": "table"
},
{
"datasource": "TestData DB",
"fieldConfig": {
"defaults": {
"color": {
"mode": "thresholds"
},
"custom": {
"align": "center",
"displayMode": "auto"
},
"mappings": [],
"thresholds": {
"mode": "absolute",
"steps": [
{
"color": "green",
"value": null
},
{
"color": "red",
"value": 80
}
]
}
},
"overrides": [
{
"matcher": {
"id": "byName",
"options": "Value"
},
"properties": [
{
"id": "custom.displayMode",
"value": "color-background-solid"
}
]
}
]
},
"gridPos": {
"h": 5,
"w": 12,
"x": 0,
"y": 9
},
"id": 7,
"options": {
"showHeader": true
},
"pluginVersion": "8.1.2",
"targets": [
{
"csvContent": "ID, DisplayText\n21412312312, Homer\n12421412413, Simpsons \n12321312313, Bart",
"hide": false,
"refId": "A",
"scenarioId": "csv_content"
}
],
"title": "Mapping data",
"transformations": [
{
"id": "configFromData",
"options": {
"applyToConfig": true,
"configRefId": "A",
"mappings": [
{
"fieldName": "Color",
"handlerKey": "mappings.color"
},
{
"fieldName": "Value",
"handlerKey": "mappings.value"
}
]
}
}
],
"type": "table"
},
{
"datasource": "TestData DB",
"fieldConfig": {
"defaults": {
"color": {
"mode": "thresholds"
},
"custom": {
"align": "center",
"displayMode": "auto"
},
"mappings": [],
"thresholds": {
"mode": "absolute",
"steps": [
{
"color": "green",
"value": null
},
{
"color": "red",
"value": 80
}
]
}
},
"overrides": [
{
"matcher": {
"id": "byName",
"options": "Value"
},
"properties": [
{
"id": "custom.displayMode",
"value": "color-background-solid"
}
]
}
]
},
"gridPos": {
"h": 10,
"w": 12,
"x": 12,
"y": 9
},
"id": 6,
"options": {
"showHeader": true
},
"pluginVersion": "8.1.2",
"targets": [
{
"csvContent": "Value, Color\nOK, blue\nPretty bad, red\nYay it's green, green\nSomething is off, orange\nNo idea, #88AA00\nAm I purple?, purple",
"hide": false,
"refId": "A",
"scenarioId": "csv_content"
}
],
"title": "Value mappings from query result applied to itself",
"transformations": [
{
"id": "configFromData",
"options": {
"applyTo": {
"id": "byName",
"options": "Value"
},
"applyToConfig": true,
"configRefId": "A",
"mappings": [
{
"fieldName": "Color",
"handlerKey": "mappings.color"
},
{
"fieldName": "Value",
"handlerKey": "mappings.value"
}
]
}
}
],
"type": "table"
},
{
"datasource": "TestData DB",
"fieldConfig": {
"defaults": {
"color": {
"mode": "thresholds"
},
"custom": {
"align": "center",
"displayMode": "auto"
},
"mappings": [],
"thresholds": {
"mode": "absolute",
"steps": [
{
"color": "green",
"value": null
},
{
"color": "red",
"value": 80
}
]
}
},
"overrides": []
},
"gridPos": {
"h": 5,
"w": 12,
"x": 0,
"y": 14
},
"id": 8,
"options": {
"showHeader": true
},
"pluginVersion": "8.1.2",
"targets": [
{
"csvContent": "ID, Value\n21412312312, 100\n12421412413, 20\n12321312313, 10",
"hide": false,
"refId": "A",
"scenarioId": "csv_content"
}
],
"title": "Display data",
"transformations": [
{
"id": "configFromData",
"options": {
"applyToConfig": true,
"configRefId": "A",
"mappings": [
{
"fieldName": "Color",
"handlerKey": "mappings.color"
},
{
"fieldName": "Value",
"handlerKey": "mappings.value"
}
]
}
}
],
"type": "table"
},
{
"datasource": "TestData DB",
"fieldConfig": {
"defaults": {
"color": {
"mode": "palette-classic"
},
"custom": {
"axisLabel": "",
"axisPlacement": "auto",
"axisSoftMin": 0,
"fillOpacity": 80,
"gradientMode": "none",
"hideFrom": {
"legend": false,
"tooltip": false,
"viz": false
},
"lineWidth": 1
},
"mappings": [],
"thresholds": {
"mode": "absolute",
"steps": [
{
"color": "green",
"value": null
},
{
"color": "red",
"value": 80
}
]
}
},
"overrides": []
},
"gridPos": {
"h": 10,
"w": 12,
"x": 0,
"y": 19
},
"id": 9,
"options": {
"barWidth": 0.97,
"groupWidth": 0.7,
"legend": {
"calcs": [],
"displayMode": "list",
"placement": "bottom"
},
"orientation": "horizontal",
"showValue": "auto",
"stacking": "none",
"text": {},
"tooltip": {
"mode": "single"
}
},
"pluginVersion": "8.1.0-pre",
"targets": [
{
"csvContent": "ID, Value\nA21412312312, 100\nA12421412413, 20\nA12321312313, 10\n",
"hide": false,
"refId": "data",
"scenarioId": "csv_content"
},
{
"csvContent": "ID, DisplayText\nA21412312312, Homer\nA12421412413, Marge \nA12321312313, Bart",
"hide": false,
"refId": "mappings",
"scenarioId": "csv_content"
}
],
"title": "Value mapping ID -> DisplayText from separate query",
"transformations": [
{
"id": "configFromData",
"options": {
"applyTo": {
"id": "byName",
"options": "ID"
},
"applyToConfig": false,
"configRefId": "mappings",
"mappings": [
{
"fieldName": "ID",
"handlerKey": "mappings.value"
},
{
"fieldName": "DisplayText",
"handlerKey": "mappings.text"
}
]
}
}
],
"type": "barchart"
}
],
"refresh": "",
"schemaVersion": 30,
"style": "dark",
"tags": [
"gdev",
"transform"
],
"templating": {
"list": []
},
"time": {
"from": "now-6h",
"to": "now"
},
"timepicker": {},
"timezone": "",
"title": "Transforms - Config from query",
"uid": "jDJ4SbVnz",
"version": 1
}