Dashboard for RDS metrics and performance insight
Also can we show the metrics from performance insight to Grafana
What happened?
What did you expect to happen?
Did you receive any errors in the Grafana UI or in related logs? If so, please tell us exactly what they were.
no
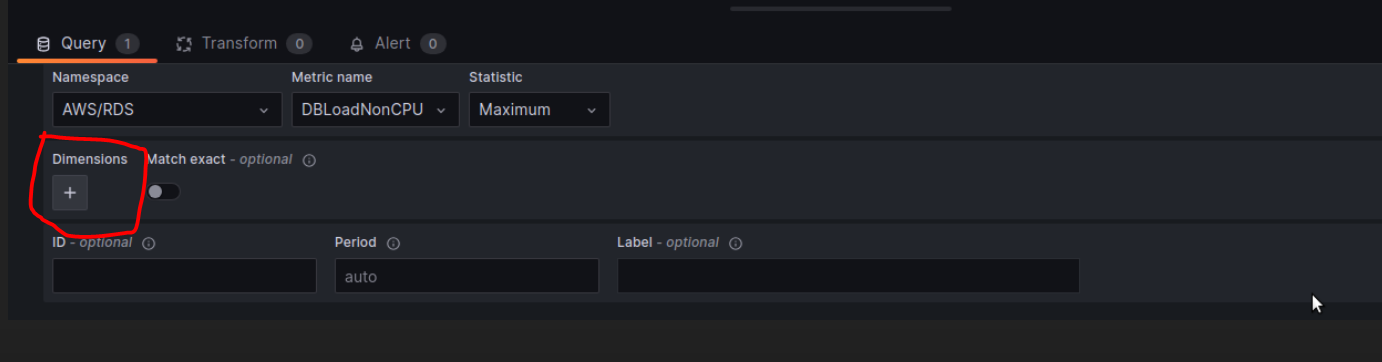
You need to specify also dimensions.
Where i can to this ? And how i can find the correct dimension ?
It is there:
Grafana may offer you Dimension names or their values in the dropdown - but you can still write own if they are not correct:
AWS Grafana GameLift Hard Coded Metrics - #2 by jangaraj
If you make a close look into your “working” metrics in the CloudWatch, then you will find that each of them has some dimensions - that’s what you need. Please note that some metrics may need multiple dimensions, not just one.
I would recommend to start with some ready RDS dashboard, e.g.
:cloud: 40+ Grafana dashboards for AWS CloudWatch metrics: EC2, Lambda, S3, ELB, EMR, EBS, SNS, SES, SQS, RDS, EFS, ElastiCache, Billing, API Gateway, VPN, Step Functions, Route 53, CodeBuild, ... ...
and then customize it for your need.
LOL thanks i am so stupid