Hi!
I’ve built a webservice that handles my data and sends a repost to Grafana in json.
The Response looks as follows:
[
{
“datapoints”: [
[
“29.7°c”,
1507000081000
],
[
“29.7°c”,
1507000081000
],
[
“29.4°c”,
1507007217000
],
[
“33.4°c”,
1505804976000
]
],
“target”: 145931
}
]
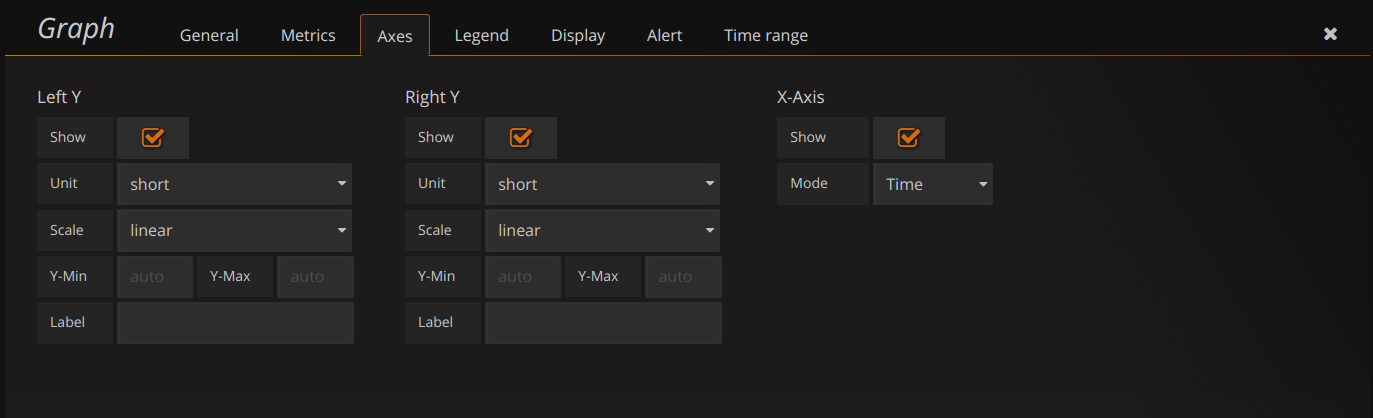
And that is created based on what I could read here: SimpleJson plugin for Grafana | Grafana Labs regarding the /query reponse. I’ve added the data source without troubles and without errors, however, I’m not able to add a metric to my graph, The fields looks as follow:

And no matter what I write in the “select metric”-field, nothing happens.
What am I missing?
Thanks in advanced! ![]()