Changing the legend of a dashboard

  • Grafana 12.0.2, installed as container from image grafana/grafana-oss:latest on macOS
  • InfluxDB 2.7, installed as container from image influxdb:2.7.

Hi,

Still being a n00b with Grafana, with less than 2 weeks of experience, I would like to change the legend in a dashboard.

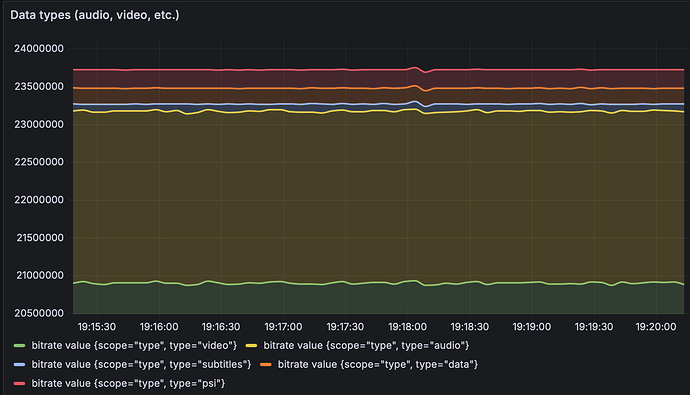
I have created this one, a stacked view of the bitrates of various data types in a MPEG transport stream for digital television.

In the legend, how could I have Video, Audio, etc. instead of bitrate value {scope="type", type="video"} ? Preferably as update of the JSON model.

Thanks a lot for your help.

You can use “Rename by Regex” transformation to have the legend display as you wish.

Examples here: Grafana

Without transformation:

With transformation:
Match: /ElectricPowerOperations.sum { region: ([^}]+)\}/
Replace: $1

Hi @grant2

Thanks a lot.

The transformation is named “rename fields by regexp”. I am not sure about what “field” means in the case of the legend. Does the regexp apply to the display in the legend?

I tried this without result on the display:

Match : /bitrate value {scope="type", type="([^"]+)"}/
Replace : $1

Trying to match your syntax, I also tried this without success: /bitrate.value { scope: type, type: ([^}]+)\}/

I must misunderstand something. Sorry for the basic level of the question.

To add more context, the legend displays bitrate value {scope="type", type="video"} by default for the following query:

from(bucket: "demo-bucket")
  |> range(start: v.timeRangeStart, stop: v.timeRangeStop)
  |> filter(fn: (r) => r["_measurement"] == "bitrate")
  |> filter(fn: (r) => r.scope == "type")
  |> filter(fn: (r) => r.type == "video")
  |> aggregateWindow(every: v.windowPeriod, fn: mean, createEmpty: false)
  |> yield(name: "mean")

Hi @lelegard and thanks for the extra info. Try this:

Match: bitrate value \{scope="type", type="([^"]+)"\}

Replace: $1

Explanation of the Match Regex:

  • bitrate value \{scope="type", type=": This part literally matches the beginning of your legend string up to type=".
  • (: This opens a capturing group. Whatever is matched inside this group will be what you can refer to with $1 in the “Replace” field.
  • [^"]+: This matches one or more characters (+) that are not (^) a double quote ("). This effectively captures everything between the type=" and the next " character.
  • ): This closes the capturing group.
  • "\}: This matches the closing double quote and curly brace.

When you use this “Match” pattern with $1 as the “Replace” pattern, Grafana’s “Rename Fields by Regex” transformation will extract “video” (or whatever word is in quotes there in your legend) and display it as your field name.

Or possibly this:
Match: /bitrate value \{scope="type", type="([^"]+)"\}/

Or skip the Grafana transformation and try adding a map function in your query:

from(bucket: "demo-bucket")
  |> range(start: v.timeRangeStart, stop: v.timeRangeStop)
  |> filter(fn: (r) => r["_measurement"] == "bitrate")
  |> filter(fn: (r) => r.scope == "type")
  |> filter(fn: (r) => r.type == "video")
  |> map(fn: (r) => ({ r with _field: r.type })) // Overwrite _field with the value of 'type'
  |> aggregateWindow(every: v.windowPeriod, fn: mean, createEmpty: false)
  |> yield(name: "mean")

Thanks @grant2. However, I am afraid that none of these works, including the modification of the query. The legend remains unchanged.

Being an old Unixian, I am familiar with all sorts of regexp. So, the problem is not the regexp itself but the identification of the input data it applies to. I am not sure to understand on what input string the regexp is applied. Probably not the text in the legend.

I don’t know either the exact rule for the default legend, how the query turns into bitrate value {scope="type", type="video"}.

If you want to have a look at this dashboard, it is in file sample-graph.json at tsduck/sample/grafana at master · tsduck/tsduck · GitHub

Here is a sample of input for InfluxDB:

bitrate,scope=ts,tsid=4 value=23694618 1751139908641
bitrate,scope=service,service=M6 value=4436800 1751139908641
bitrate,scope=service,service=W9 value=5109690 1751139908641
bitrate,scope=service,service=Arte value=5008922 1751139908641
bitrate,scope=service,service=France\ 5 value=3482662 1751139908641
bitrate,scope=service,service=6ter value=5410790 1751139908641
bitrate,scope=service,service=global value=245754 1751139908641
bitrate,scope=type,type=psi value=245754 1751139908641
bitrate,scope=type,type=video value=20848147 1751139908641
bitrate,scope=type,type=audio value=2276755 1751139908641
bitrate,scope=type,type=subtitles value=114906 1751139908641
bitrate,scope=type,type=data value=209056 1751139908641

The dashboard uses data with scope=type only.
@grant2, after several tests, I found the solution.

Original legend: bitrate value {scope="type", type="video"}
The regexp must be /value {scope="type", type="([^"]+)"\}/
Transformed legend: video

The leading word bitrate was not part of the input string on which the regexp applies. However, the word bitratedisappears when the regexp is successfully applied to the rest of the text.

There must be some weird rule.

Hi @lelegard

Even though you have solved this, try disabling the transformation and see what this Flux query gives you. I think it might give you the labels you are looking for (video, audio, etc.).

from(bucket: "demo-bucket")
  |> range(start: v.timeRangeStart, stop: v.timeRangeStop)
  |> filter(fn: (r) => r["_measurement"] == "bitrate")
  |> filter(fn: (r) => r.scope == "type")
  |> filter(fn: (r) => r.type == "video")
  |> group(columns: ["type", "_measurement"], mode:"by") 
  |> aggregateWindow(every: v.windowPeriod, fn: mean, createEmpty: false)
  |> yield(name: "mean")

Hi @grant2.

I am afraid that it doesn’t work. Neither this last one with a group() filter, nor the previous one you suggested with a map() filter. In all cases, the legend remains bitrate value {scope="type", type="video"}.

I found the solution I mentioned after some tests. Instead of trying to replace the whole text of the legend, I tried to replace a small part of it first. I noticed that when the initial bitrate word was part of the expression, nothing happened. However, when bitrate was not in it, then 1) the regexp worked and 2) bitrate disappeared. The solution then became straightforward.

It seems that the legend is not one text but the concatenation of two. There is bitrate first (the measurement name) and then value {scope="type", type="video"}, the text on which we can apply the regexp. Why is the measurement name displayed first but disappears when a transformation is applied on the second part of the legend is still a mystery.

Hi @lelegard

Are you creating separate queries for each type (video, audio, etc)? In my example linked below, I have a similar query but did not need a transformation or anything to get the legend to display correctly. The key difference is that I used a variable for ‘region’. I think if you create a variable for ‘type’ then you could create one single Flux query and it would render the legend as you want it to me.

Yes, that is the way I did. My knowledge of Grafana is embryonic only and I did it the simple way. In practice, I tested one query. Then, I exported the JSON model, copy/paste/edit to duplicate the query for all types and reimported it.

There must be more clever ways. I will look at the queries in the dashboard you pointed to.