Hi Team,
I have created a diagram with multiple hosts using grafana diagram plugin.Is there a way we can change the colour of the host if the host is down
Hi Team,
I have created a diagram with multiple hosts using grafana diagram plugin.Is there a way we can change the colour of the host if the host is down
For the graph panel, there is a threshold feature. Here is an example on the Grafana demo site: http://play.grafana.org/dashboard/db/graph-styles?panelId=11&fullscreen&edit&orgId=1&tab=display
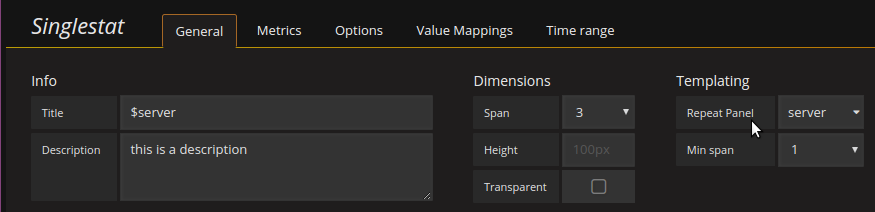
Otherwise, people usually use Singlestat panels for showing if a host is up or down. It is quite easy to get a singlestat panel per host using the repeating panels feature:
Here is an example of that:
http://play.grafana.org/dashboard/db/templating-repeated-panels?orgId=1
Hi Danillee
Thanks for the reply.
i have already created the status using the single stat panel. but i am looking for an option in the diagram panel so that we can view the status of all hosts at a time.
And the threshold feature in the graph panel does not work for you?