Canvas panel - button element API

Hi,

I am using the Canvas panel to use http or rest to remotely switch a digital relay device.

I have managed to succesfully do this using one of the standard elements and then thought I would try to rather use the experimental Element namely BUTTON. I am using a GET call without any authenticam just to retrurn the device status.

I first used POSTMAN and it returns the status data, no problems (CORS ETC).

I used one of the standard Elements and it too worked without any problem as with POSTMAN using the INFINITY Datasource

I then tried the Button element as shown below

and it too returned the status data without any problem as shown below.

However if I try and use the same URL in the Button element GET menu I get an error

This is the console output

So the issue is why is the same URL working in the Infinity datasource but the very same url in the button element menu gives an error?

Using Grafana 12.0.1

Any suggestions welcome.

1 Like

Do you have local installation of Grafana? Is it configured to HTTP or HTTPS access?

1 Like

Thank you for responding

I have a remote server installation which uses http.
I have a local IoT device which uses http

All the rest calls within the grafana query work fine as do those from postman using http within my PC’s CHROME browser. It is just the rest calls in the Canvass edit menu which does not work?

REMOTE *********************************************** LOCAL

SERVER (http) ------------------------------------------- remote device (http)
|---------------- PC running GRAFANA (http in browser)

Anything interesting showing in browser console or browser network tab? Or even grafana logs?

Thank you but the only info I have is from the PC browser log as shown in my original post.

I looked at the Grafana log and there is no reference to the rest call from the CPANEL in the Grafana log.

I used 2 different REST calls to ensure this?

Both different calls worked fine within GRAFANA?

Seems to be a CPANEL issue? They need to test the CPANEL and provide clear documentation in terms of http, https and CORS if applicable?

The real problem is that if one does the REST call in GRAFANA then the action is repeated on every update opposed to just a single action when the CPANEL Test button is used or the TEST API facility within CPANEL.

This what I mean when I say Grafana, which works

This is what I mean when I say within CPANEL, which gives error

There are videoes where this is shown to work within CPANEL, but no info on what settings are required to achieve this.

All I know is that I can switch the remote device from within GRAFANA, from postman from direct http calls in the browser but not from with the CAPNEL menu.

Look at the error message, it says check browser console

Hard to help without seeing what the exact error in browser console is

See the original post

Oops sorry I am blind. Obviously the error is on the API endpoint part. Can you see what is going on the API part? Why is it refusing connection?

I have no idea?

The device is an embedded IoT device with no log.

As I noted the problem seems to be with the Canvass Panel. As noted it works fine with all others REST calls, hence my post.:man_shrugging:

Grafana Canvas button can also work with API calls, you can try for example this endpoint to confirm this fact.

Most likely your device doesn’t provide necessary headers in response to API request (i.e. Access-Control-Allow-Origin).

At the same time call to your API works fine in Postman, because Postman doesn’t enforce CORS restrictions (unlike browser where you try your request from Grafana’s canvas)

1 Like

so I captured a fake api call and this is what I see in my browser network tab

Do you have documentation for the rest api stack @expoenergy

Ok tried it out and same error. I aalso set CORS to * (accept all) and is still gives the same error!

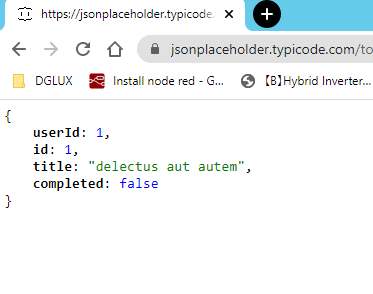
Ok so in browser I get

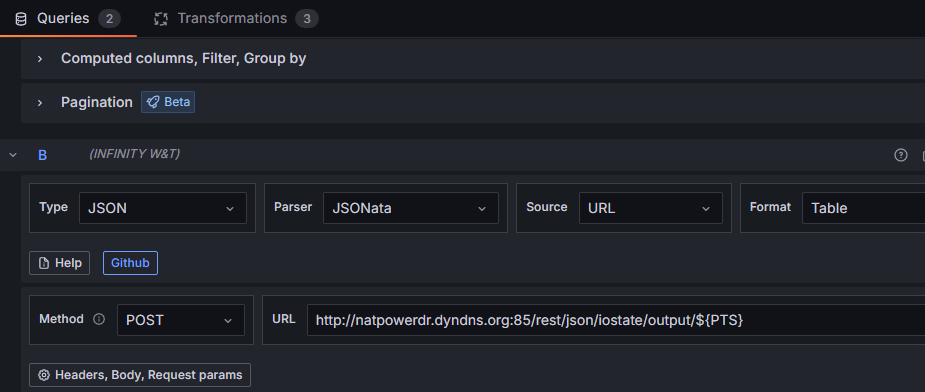
In Grafana using Inbfinity Datasource I get

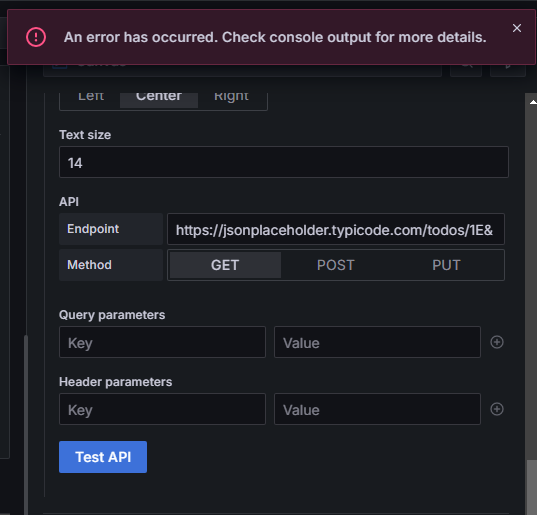
In Canvas Edit Paner I get when I press TEs API

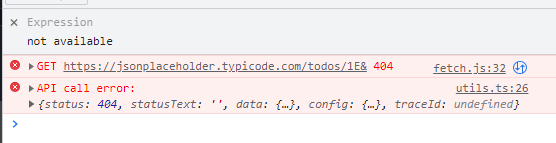
From the brower Consol I get

This is the first line

  1. Request URL:

https://jsonplaceholder.typicode.com/todos/1E&

  1. Request Method:

GET

  1. Status Code:

404

  1. Remote Address:

104.21.64.1:443

  1. Referrer Policy:

strict-origin-when-cross-origin

  1. Response Headers

  2. access-control-allow-credentials:

true

  1. access-control-allow-origin:

http://expoenergy.dedicated.co.za:3000

  1. age:

685

  1. alt-svc:

h3=“:443”; ma=86400

  1. cache-control:

max-age=43200

  1. cf-cache-status:

HIT

  1. cf-ray:

954582154b493517-JNB

  1. content-length:

2

  1. content-type:

application/json; charset=utf-8

  1. date:

Mon, 23 Jun 2025 16:54:35 GMT

  1. etag:

W/“2-vyGp6PvFo4RvsFtPoIWeCReyIC8”

  1. expires:

-1

  1. nel:

{“report_to”:“heroku-nel”,“response_headers”:[“Via”],“max_age”:3600,“success_fraction”:0.01,“failure_fraction”:0.1}

  1. pragma:

no-cache

  1. report-to:

{“group”:“heroku-nel”,“endpoints”:[{“url”:“https://nel.heroku.com/reports?s=2pZYlH2ki7Of3cImKpnl%2Bzt2OMi8UQ2hBdLntaoLvBs%3D\u0026sid=e11707d5-02a7-43ef-b45e-2cf4d2036f7d\u0026ts=1750696989"}],"max_age”:3600}

  1. reporting-endpoints:

heroku-nel=“https://nel.heroku.com/reports?s=2pZYlH2ki7Of3cImKpnl%2Bzt2OMi8UQ2hBdLntaoLvBs%3D&sid=e11707d5-02a7-43ef-b45e-2cf4d2036f7d&ts=1750696989

  1. server:

cloudflare

  1. server-timing:

cfL4;desc=“?proto=QUIC&rtt=4319&min_rtt=2199&rtt_var=2548&sent=12&recv=11&lost=0&retrans=0&sent_bytes=4665&recv_bytes=3802&delivery_rate=413357&ss_exit_cwnd=0&ss_exit_reason=0&cwnd=16614&unsent_bytes=0&cid=68d888ed8924be80&ts=292&inflight_dur=49&x=103”

  1. vary:

Origin, Accept-Encoding

  1. via:

2.0 heroku-router

  1. x-content-type-options:

nosniff

  1. x-powered-by:

Express

  1. x-ratelimit-limit:

1000

  1. x-ratelimit-remaining:

996

  1. x-ratelimit-reset:

1750697027

  1. Request Headers

  2. :authority:

  1. :method:

GET

  1. :path:

/todos/1E&

  1. :scheme:

https

  1. accept:

application/json, text/plain, /

  1. accept-encoding:

gzip, deflate, br

  1. accept-language:

en-ZA,en-US;q=0.9,en;q=0.8,de-DE;q=0.7,de;q=0.6

  1. origin:

http://expoenergy.dedicated.co.za:3000

  1. referer:

http://expoenergy.dedicated.co.za:3000/

  1. sec-ch-ua:

“Not_A Brand”;v=“99”, “Google Chrome”;v=“109”, “Chromium”;v=“109”

  1. sec-ch-ua-mobile:

?0

  1. sec-ch-ua-platform:

“Windows”

  1. sec-fetch-dest:

empty

  1. sec-fetch-mode:

cors

  1. sec-fetch-site:

cross-site

  1. user-agent:

Mozilla/5.0 (Windows NT 10.0; Win64; x64) AppleWebKit/537.36 (KHTML, like Gecko) Chrome/109.0.0.0 Safari/537.36

  1. x-grafana-action:

1

  1. x-grafana-device-id:

fe2f33aec7a136c923e5b4482cd0ff4e

This is the second line.

utils.ts:26 API call error:

  1. {status: 404, statusText: ‘’, data: {…}, config: {…}, traceId: undefined}

  2. config:

1. data: undefined
2. headers:

  1. X-Grafana-Action: "1"
  2. X-Grafana-Device-Id: "fe2f33aec7a136c923e5b4482cd0ff4e"
  3. [[Prototype]]: Object

    1. constructor: ƒ Object()
    2. hasOwnProperty: ƒ hasOwnProperty()
    3. isPrototypeOf: ƒ isPrototypeOf()
    4. propertyIsEnumerable: ƒ propertyIsEnumerable()
    5. toLocaleString: ƒ toLocaleString()
    6. toString: ƒ toString()
    7. valueOf: ƒ valueOf()
    8. __defineGetter__: ƒ __defineGetter__()
    9. __defineSetter__: ƒ __defineSetter__()
    10. __lookupGetter__: ƒ __lookupGetter__()
    11. __lookupSetter__: ƒ __lookupSetter__()
    12. __proto__: (...)
    13. get __proto__: ƒ __proto__()
    14. set __proto__: ƒ __proto__()

3. hideFromInspector: false
4. method: "GET"
5. retry: 0
6. url: "https://jsonplaceholder.typicode.com/todos/1E&"
7. [[Prototype]]: Object
  1. data: {}
  2. status: 404
  3. statusText: “”
  4. traceId: undefined
  5. [[Prototype]]: Object
1. constructor: ƒ Object()
2. hasOwnProperty: ƒ hasOwnProperty()
3. isPrototypeOf: ƒ isPrototypeOf()
4. propertyIsEnumerable: ƒ propertyIsEnumerable()
5. toLocaleString: ƒ toLocaleString()
6. toString: ƒ toString()
7. valueOf: ƒ valueOf()
8. __defineGetter__: ƒ __defineGetter__()
9. __defineSetter__: ƒ __defineSetter__()
10. __lookupGetter__: ƒ __lookupGetter__()
11. __lookupSetter__: ƒ __lookupSetter__()
12. __proto__: (...)
13. get __proto__: ƒ __proto__()
14. set __proto__: ƒ __proto__()

please clean up that wall of text, it is not readable

also you have https://jsonplaceholder.typicode.com/todos/1E& instead of https://jsonplaceholder.typicode.com/todos/1

what is adding the E&

Yes here is the download link

Note on the IoT device I set CORS to * which is accept all and it makes no difference?

Many thanks for assistance.

see page 66

You have extra characters in URL. Correct URL works:

2 Likes

not just *

even then, it is dangerous to allow all like that, you need to specify the url of grafana, unless something else also needs access to this endpoint
BUt for now test it using „*"

Thanks and yes I am just testing at the moment.

No difference?

please post http the payload sent from Postman and compare it to what grafana is sending across the wire.

the next step might be contacting the manufacturer of this iot device and ask for tech support.

Hi,

I am not using POST only GET.

No parameters and no payload required

I am just querying the status of the outputs. This same info is returned with the GRAFANA query.

It is the Canvas Panel which is the problem.

I will contact the provider but the question is why goes and why will it work in the GRAFANA query but not in Canvas Panel query?

This suggests that there is some difference between the GRAFANA and PANEL query?

For example this all works fine in NODE RED, no such issues

{
“info”: {
“request”: “/rest/json”,
“time”: “2025-06-23,20:58:47”,
“ip”: “192.168.3.205”,
“devicename”: “WEBIO-0A5C4D”
},
“iostate”: {
“output”: [
{
“number”: 0,
“state”: 0
},
{
“number”: 1,
“state”: 0
},
{
“number”: 2,
“state”: 0
},
{
“number”: 3,
“state”: 0
},
{
“number”: 4,
“state”: 0
},
{
“number”: 5,
“state”: 0
},
{
“number”: 6,
“state”: 0
},
{
“number”: 7,
“state”: 0
}
]
},
“system”: {
“time”: “2025-06-23,20:58:47”,
“diagnosis”: [
{
“time”: “23.06.2025 20:58:47”,
“msg”: “Device status: OK”
}
],
“diagarchive”: [
{
“time”: “23.06.2025 20:58:47”,
“msg”: “Device status: OK”
}
]
}
}

NODE RED

well, that seems to be the issue but let’s not jump to conclusion yet, it could also be your endpoint and the configuration.

Which GRAFANA query?