I am trying to create a specific type of barchart. To understand it better, I will describe my data.
I have multiple LUNs on a storage system. Each LUN is associated with its name and two values: the “Total” space being assigned to LUN and the ‘Used’ space that is actually used. These data exists in influxdb.
I managed to create a series of bars, one bar of each LUN, representing the “Used” space. What I woud like to do, is create the same series of bars, but I would like each bar to have two sections (stacked mode) to represent the “Total” and the “Used” values.
A sample of my data is the following. I did not present it in the first place because I am not sure if the data format is appropriate for what I want to create and I did not want that to be a constrain.
Well, my idea was to have one bar per LUN, that would “stack” the “Used”/“Total” values on the same bar in order to check visually the size of the LUN and the part of it that is used. The bars from all LUNs would ideally be displayed on next to the other, in order to have a total view of the storage and be able to check at a glance which LUN consumes the most. Also by chaging the grafana time frame, you should be able to see which LUN grew larger.
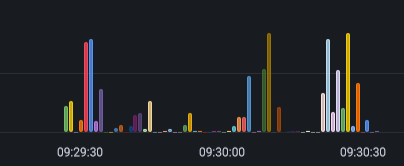
Right now I have this barchart that displays the “Used” values of the LUNs.
The query is this: SELECT mean("Tot_Rsvd") as Size FROM "showvv_3par" WHERE ("dev" = '3par' ) AND $timeFilter GROUP BY time($__interval), "lun" fill(null)