-
What Grafana version and what operating system are you using?
Non-working version: Grafana community 11.0 (docker on linux)
Working version: Grafana community v8.3.4 (docker on linux) -
What are you trying to achieve?
I am trying to use a single dashboard to query multiple azure data explorer data sources. Each source is using different database names for my data so depending on the datasource I am using I will need to use a different database name. -
How are you trying to achieve it?
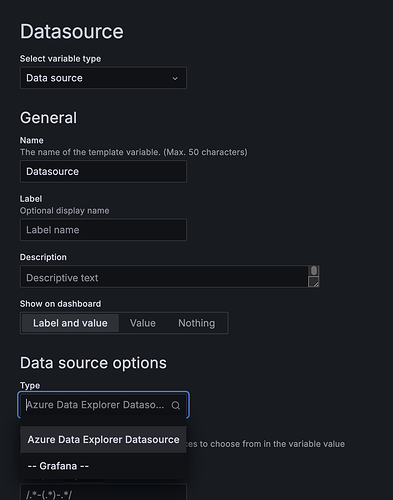
To do this I have created variables to select my datasource:
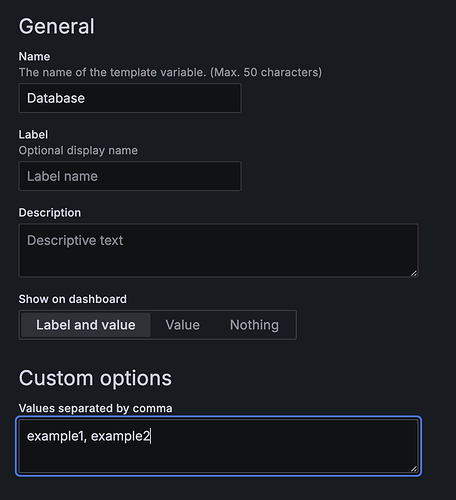
I have also created variables to choose my database:
In my widget’s KQL query I am then referring to the database variable:
database(‘$Database’).my_table_name
| take 1
- What happened?
After switching from one datasource which has a database called “example1” to another datasource which only has a database called “example2” the ADX request updates the KQL query portion of the request but still refers to the previous value in the database portion of the request. Thus the query fails & the dashboard fails to load. This is not resolved by reloading the dashboard or webpage. But oddly it is resolved by opening each widget and clicking “run query” in edit mode.
Dumped network request:
{
“queries”: [
{
“datasource”: {
“type”: “grafana-azure-data-explorer-datasource”,
“uid”: “removed”
},
“database”: “example1”,
“expression”: {
“groupBy”: {
“expressions”: ,
“type”: “and”
},
“reduce”: {
“expressions”: ,
“type”: “and”
},
“where”: {
“expressions”: ,
“type”: “and”
}
},
“pluginVersion”: “4.6.3”,
“query”: “database(‘example2’).my_table_name\n| take 1”,
“querySource”: “raw”,
“queryType”: “KQL”,
“rawMode”: true,
“refId”: “A”,
“resultFormat”: “table”,
“clusterUri”: “”,
“datasourceId”: 14,
“intervalMs”: 120000,
“maxDataPoints”: 714
}
],
“from”: “1723756898050”,
“to”: “1723843298050”
}
- What did you expect to happen?
I expected the dashboard to reload fetching data from the new database and produce the same query on dashboard reload that is generated when clicking “run query” in the widget edit mode:
{
“queries”: [
{
“datasource”: {
“type”: “grafana-azure-data-explorer-datasource”,
“uid”: “removed”
},
“database”: “example2”,
“expression”: {
“groupBy”: {
“expressions”: ,
“type”: “and”
},
“reduce”: {
“expressions”: ,
“type”: “and”
},
“where”: {
“expressions”: ,
“type”: “and”
}
},
“pluginVersion”: “4.6.3”,
“query”: “database(‘example2’).my_table_name\n| take 1”,
“querySource”: “raw”,
“queryType”: “KQL”,
“rawMode”: true,
“refId”: “A”,
“resultFormat”: “table”,
“clusterUri”: “”,
“datasourceId”: 14,
“intervalMs”: 120000,
“maxDataPoints”: 574
}
],
“from”: “1723757238447”,
“to”: “1723843638448”
}
- Did you receive any errors in the Grafana UI or in related logs? If so, please tell us exactly what they were.
On dashboard load I am getting 400 errors due to the incorrect table name in the “database” section of the request:
This error keeps occuring on dashboard reload until I open the widget & click “run query”. Then the dashboard loads fine even on reload until I switch database again.
Am I missing some configuration? This same pattern was working for me in Grafana 8.3.4 but is no longer working after upgrading to 11.0
How can I choose a new database using dashboard variables with azure data explorer?


