So i tryed to use the graph in Grafana with my MSSQL Data Source
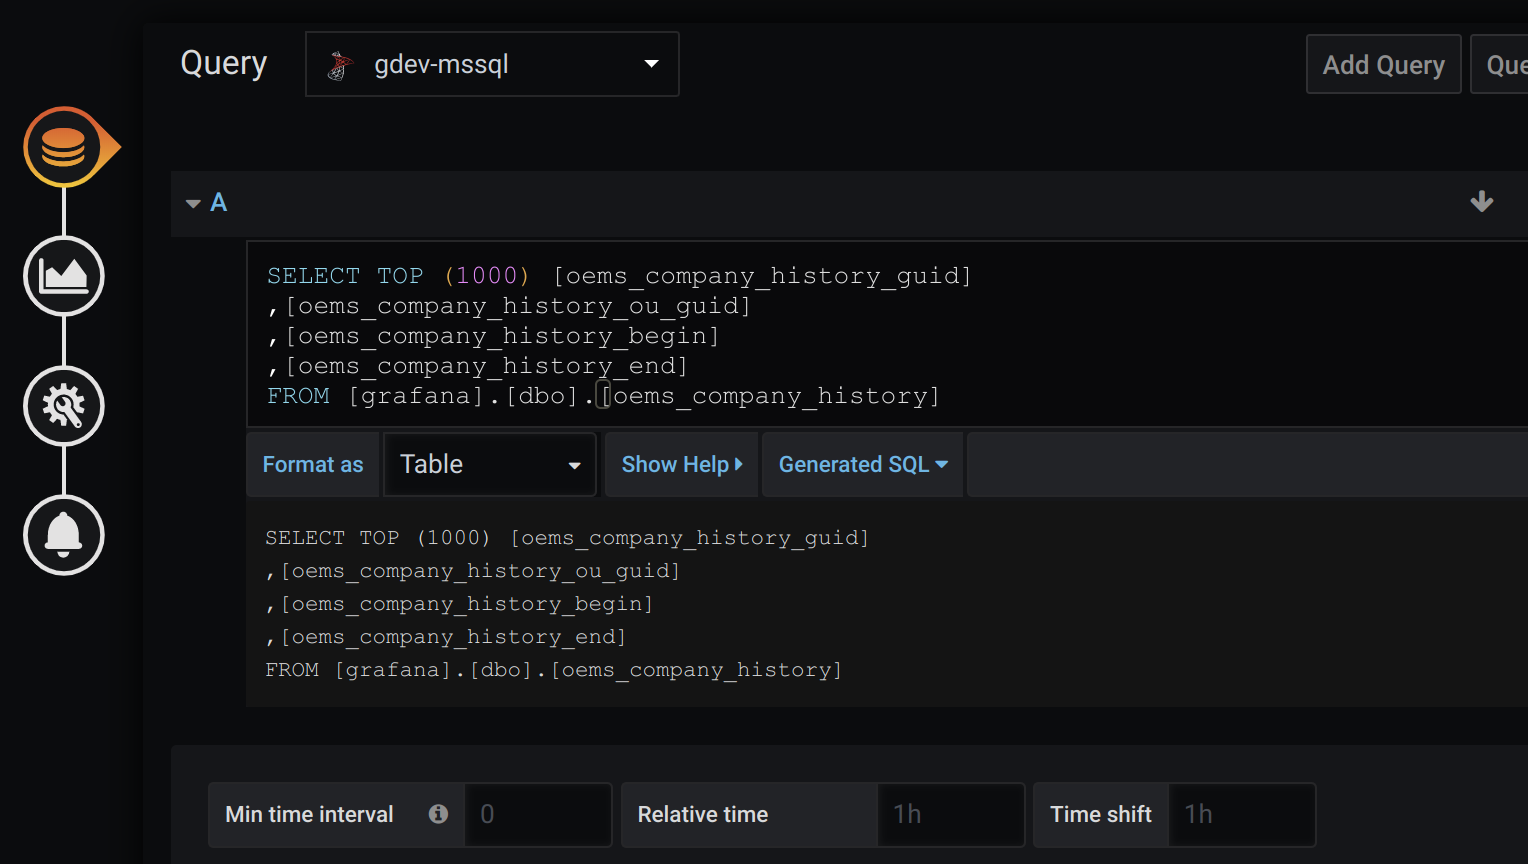
SELECT TOP (1000) [oems_company_history_guid]
,[oems_company_history_ou_guid]
,[oems_company_history_begin]
,[oems_company_history_end]
FROM [Exmaple].[dbo].[oems_company_history]
and i always get the error , Wrong Syntax near “<” … Can someone help me?
Can you see the Generated SQL?
I just created a simple table with the same name as yours and the query worked:
But a query without a where clause is not a good idea. You should be using the Grafana time range to limit the query.
If you want to visualize it in a graph then you have to format the result correctly to get time series data.
Here is an example query that returns time series data (a time column, a name column and a value column). It uses macros like $__timeFilter() to make it easier to write the query.
SELECT
  $__timeGroup(createdAt,'$summarize') as time,
  avg(value) as value,
  'started' as metric
FROM
  grafana_metric
WHERE
  $__timeFilter(createdAt) AND
  measurement = 'payment.started'
GROUP BY $__timeGroup(createdAt,'$summarize')
ORDER BY 1
Ok and how would that query look like if i would u se
 Select nn.ComputerID, client.ComputerName , count(*) as Anzahl
From oems_client_nn_software as nn
Left Join oems_client as client on client.ComputerID = nn.ComputerID
 GROUP BY  nn.ComputerID, client.ComputerName
?? couldu show a example with that?
For time series data, you need a date time column. Do you have one?
If you don’t have a time column then there is not much point in trying to visualize a trend over time - which is what the graph panel does.
well i wanted to use the pie chart to show for example , how many diffrent software are installed on one Client , but i cant use pie chart because he wants a colum namend " time " is there no other way?