Hi all,
After update to 6.0.0 i see problem with new alerts
I set notification channel via e-mail ( Test is work)
And set new dashboard with alerting, then i test rule and state: “alerting”
but
Status alert do not update to red and it its still white/grey.
what am I doing wrong?
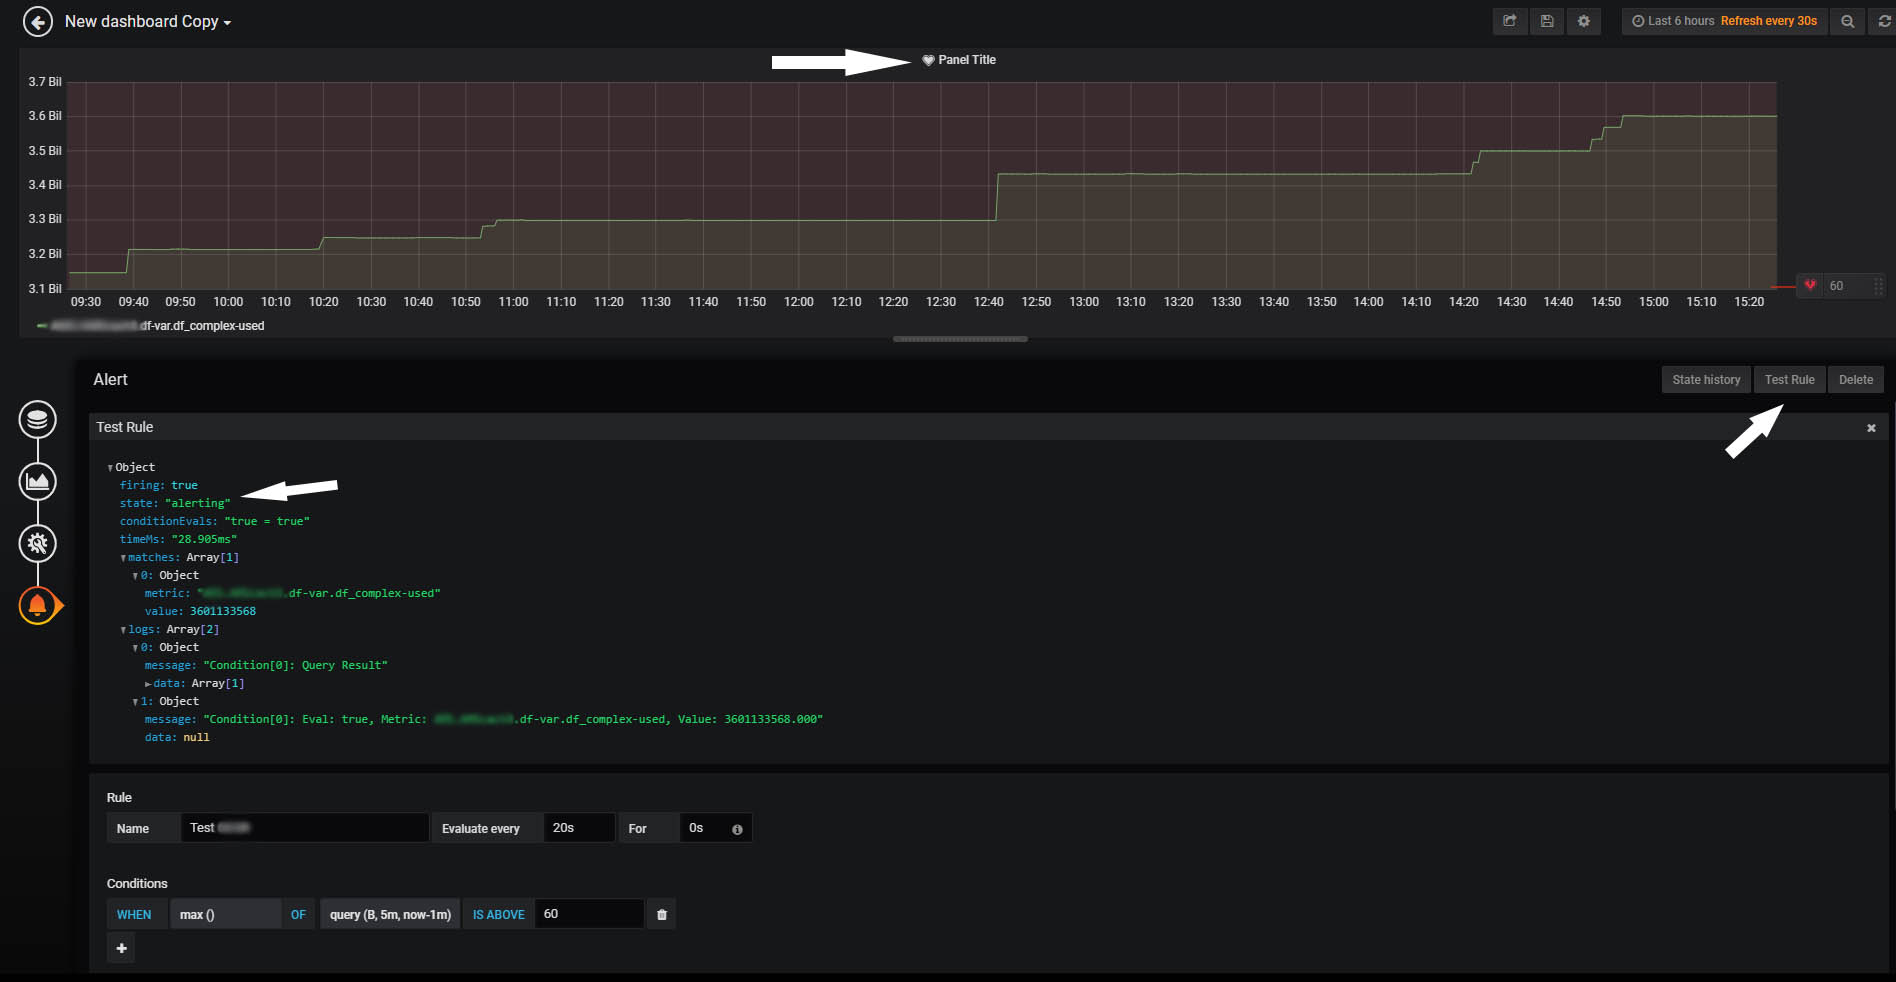
Can you screenshot the rest of the alert settings, and possibly show what query looks like B (redacted as needed)?
Is there anything in the State History?
From the above it looks like a no-data/null state being ignored.
State History is null
No state changes recorded
Object
firing:true
state:"alerting"
conditionEvals:"true = true"
timeMs:"17.995ms"
matches:Array[1]
0:Object
metric:"TEST.TEST.df-var.df_complex-used"
value:3352449024
logs:Array[2]
0:Object
message:"Condition[0]: Query Result"
data:Array[1]
0:Object
name:"TEST.TEST.df-var.df_complex-used"
points:Array[30]
0:Array[null,1553244370]
1:Array[3351347200,1553244380]
2:Array[null,1553244390]
3:Array[null,1553244400]
4:Array[3352408064,1553244410]
5:Array[null,1553244420]
6:Array[null,1553244430]
7:Array[3352383488,1553244440]
8:Array[null,1553244450]
9:Array[null,1553244460]
10:Array[3352383488,1553244470]
11:Array[null,1553244480]
12:Array[null,1553244490]
13:Array[3352383488,1553244500]
14:Array[null,1553244510]
15:Array[null,1553244520]
16:Array[3352383488,1553244530]
17:Array[null,1553244540]
18:Array[null,1553244550]
19:Array[3352383488,1553244560]
20:Array[null,1553244570]
21:Array[null,1553244580]
22:Array[3352383488,1553244590]
23:Array[null,1553244600]
24:Array[null,1553244610]
25:Array[3352449024,1553244620]
26:Array[null,1553244630]
27:Array[null,1553244640]
28:Array[3352449024,1553244650]
29:Array[null,1553244660]
1:Object
message:"Condition[0]: Eval: true, Metric: TEST.TEST.df-var.df_complex-used, Value: 3352449024.000"
data:null
Query
TEST.TEST.df-var.df_complex-used

up, any tip? In mysql database alert exist.
I will need to test this, the “when” setting of “last()” might be causing the problem as the last value is null, but “all values” are not null so it does not trigger.
Querying every 20 seconds might also be introducing these null values.
Grafana has a limit alerts in all organizations? Currently i have almost 3k alerts. Maybe this is a problem?
Because i test this same datasource and query in other grafana instance “fresh” and it works ![]()
Are you using a Hosted Grafana instance via grafana.com, or are you running it yourself?
From this code it appears there is a hard limit of 1000 for the exec queue. If you have a full queue, it’s likely not being scheduled. I haven’t tested this yet, but that may be the issue.
problem resolved, I have increased the limits in the database (MySQL)
SET SESSION MAX_EXECUTION_TIME=2000;
SET GLOBAL MAX_EXECUTION_TIME=2000;
Thx bkgann for help ![]()