Dear Grafana Support Team,
I am encountering an issue with the alerting triggers in Grafana and seek your assistance.
Background:
I have configured an alerting trigger on Grafana.
The rule for the trigger is set to initiate an evaluation when the latest queried value falls below a predetermined threshold.
The evaluation strategy involves assessing the latest value every 10 minutes, four times in succession. If the trigger condition is met, an alert is sent.
Issue Encountered:
I’ve noticed that the system triggers an alert even when the preset conditions are not met.
Analysis and Concern:
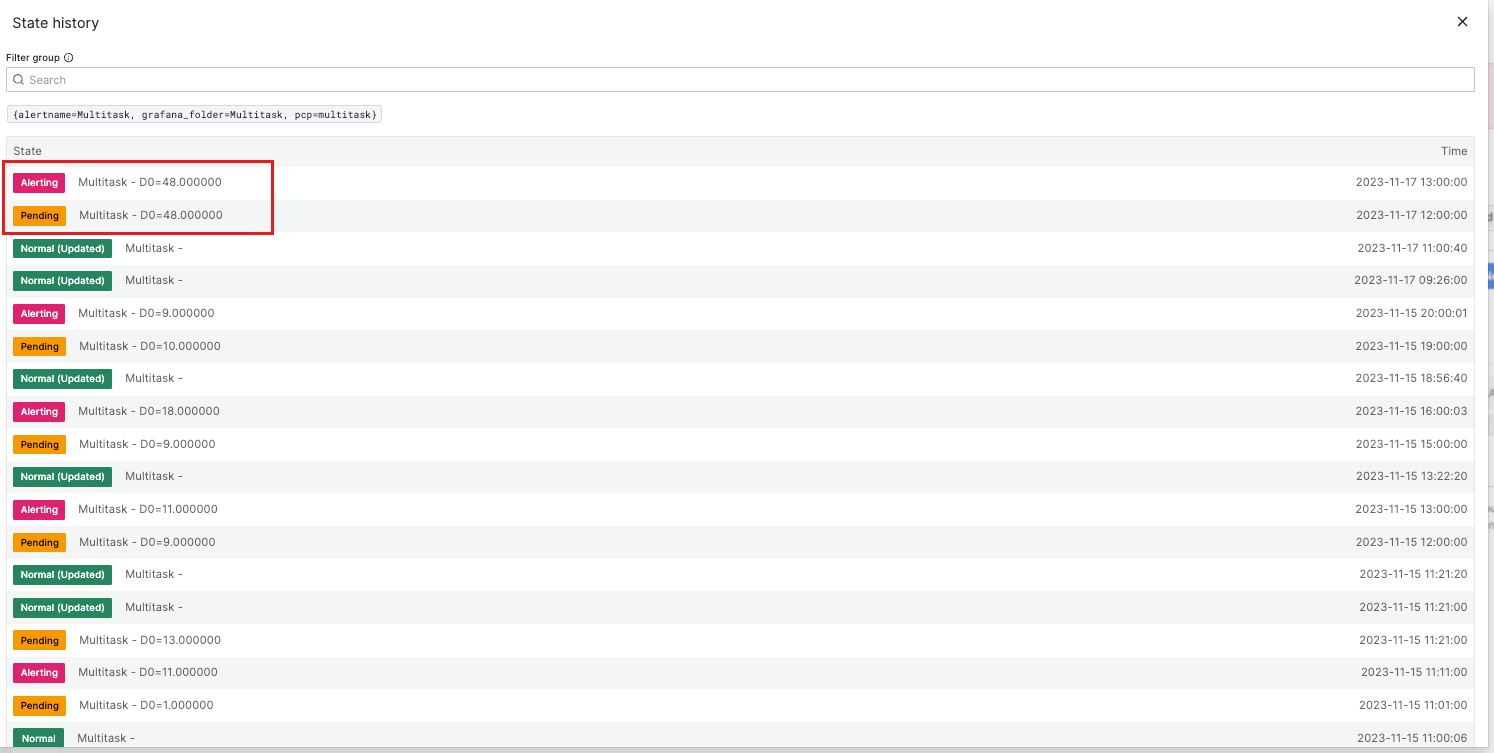
Upon examining the “show state history,” it appears that the expression values obtained during the evaluation process are incorrect, not aligning with the actual latest values I have been monitoring. My real-time values have consistently been at 64, yet the “show state history” displays significantly lower values. Please see the attached screenshots for reference.
I have attempted basic troubleshooting but am unable to pinpoint the exact cause of this issue. Thus, I am reaching out for your expert guidance and assistance in resolving this matter.
Thank you for your time and support. I look forward to your response.
Best Regards