Cannot seem to figure out alerting quite right… using blackbox+prometheus to monitor a few sites, seems like grafana assumes the output of probe_success to be the opposite of what it should be
How do I correct this?
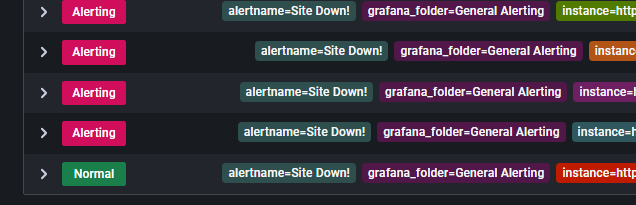
Here you can see where I have one site down and the rest are up but grafana has this all backwards??
TIA