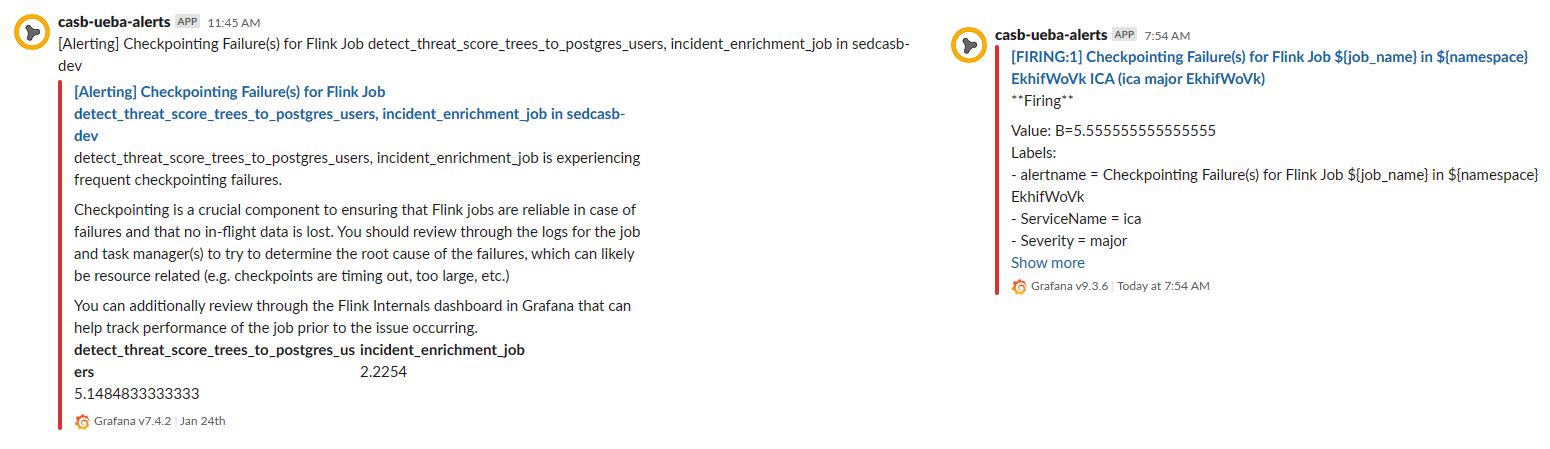
We upgraded from 7.4.2 to 9.3.6 and the alert references to ${<name.} is no longer working. See the image comparison. Can someone help?
Hi! The template ${variable} is a feature of the old alerting product, and isn’t available in the newer Grafana Alerting. That said, the migration that would have been run when you upgraded from 7.4.2 to 9.3.6 should have changed this for you. Could you please open an issue on github.com/grafana/grafana with as much information as possible as this looks like a bug.
Hello,
Thank you for the response. I will open a ticket shortly. How do we run the migration? Or what is the new format so we can manually update them to get back to working order? Our deployment did not go down an upgrade path but a re-install. Thanks.
Hi George,
Any thoughts or documentation you can help point us to for resolving this? Much appreciated.
Hi @mphambrc,
Here is Grafana documentation about referencing variable labels/values:
Maybe you will find next post useful (check also linked topics on that post and other posts from georgerobinson ):
Best regards,
ldrascic
Thank you for the response and references. I am not sure if that answers my general question. We have a lot of alerts and at this point we’re trying to understand simply: "What is the new syntax for ${} we used to use? From the screenshot I posted originally, is it {{ $labels.namespace }} or {{ $namespace }} now? Are you saying we have to go through and define all that in each alert spefically for each environment/namespace we might have vs getting the current context like we have been? We mine as well revert back to 7.4.2. Sorry a bit confused on my part.
Hi! The migration is run automatically when Grafana starts and will have run the first time you upgraded to 9.3.6. However, I have just tested it and it doesn’t look like messages with variables (i.e. ${instance} is down) are updated to use labels.
For example, what happens is that during the migration the following message:

is made into a custom annotation called “Message”:

However, ${instance} is down is not valid here, and it should be {{ $labels.instance }} is down }}.
Hi George,
Thank you for explaining that. We did start to realize that label references in the Alert name or Group name is no longer supported. Using your example above does resolve the value within the annotation. However, it seems to only work when the conditions used is NOT “Classic Condition”. We have to choose one of the newer types in order for the label values to be exposed from the query. Is that correct? Also, there is a diff() and diff_abs() operator in v7.4, however I am unable to find the equivalent of diff() to use in the condition. As I understand it, diff() is the difference between the first field and the last field. There is a “Last” option under Reduce but no “First”. I found abs() under Math but no diff(). Not sure how we can accomplish that logic now in 9.3.6. Can you help clarify? Thanks.
Also @georgerobinson, we imported some dashboards from v9.3.6 into v9.3.6 and it looks like the alerts associated in the json is not being imported. Is this a known issue or did we do something wrong? I have tried doing the import multiple ways and with both normal and external export of the dashboard via 9.3.6. Thanks.
Good morning! Last night I opened a pull request to fix the migration of templates from old to new alerting. You can find it here Alerting: Migrate old alerting templates to use $labels by grobinson-grafana · Pull Request #62911 · grafana/grafana · GitHub.
If I remember correctly the reason it doesn’t work in Classic Conditions is because when you have multiple series, the classic condition will pick which ever series is exceeding the condition. This means that $labels can change from one evaluation to the next without the original alert resolving and a new alert firing.
Thank you @georgerobinson. Will your change be in the 9.4.0-beta build? Also, I spent last night and today trying out 9.4.0-beta all the way back to v9.0 and could not load the alerts with the dashboard as part of a provisioned template. I finally went back to our prev working version of 7.4.2 and the alerts loaded with the dashboard so not sure if your fix addresses this issue also or if this is something totally different? Appreciate the help and sorry for all these messages.