Hi all,
Purpose: Output all queries results to annotations then send notifications to my contact points, like email, Slack, etc.
I have 3 endpoints for alert queries for testing. I ran queries to show the result values.
And also related reduces and thresholds. There are warnings telling me reduces are not necessary but that is not the point. I just want to check if I can output all values.
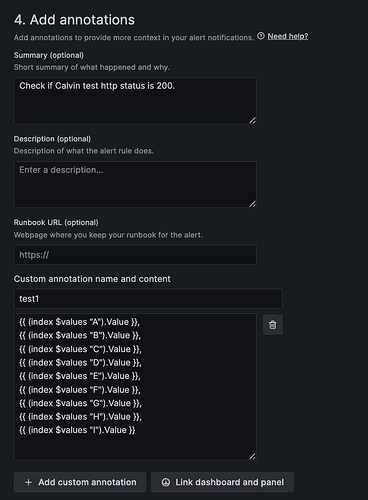
Add all queries values to annotations. Then if the alert fires, these annotations will be sent to contact points.
However, I can only receive the alert condition related values. For this example, F is the alert condition threshold. So the related values of C, F and I are 400, 1 and 1. Other values are all 0.
Here is the annotations json in my OnCall outgoing webhook payload.
"annotations": {
    "description": "__alert_rule_namespace_uid__=c1684d85-2227-40d2-8842-c0f61b76d7da, __alert_rule_uid__=d67705a3-1f37-4855-98ab-b4f43d3d8c3d, __name__=probe_http_status_code, alertname=Check Calvin test status 200, grafana_folder=Murano, instance=https://calvin20211012.apps.exosite.io/api:1/diode, job=blackbox\n0",
    "summary": "Check if Calvin test http status is 200.",
    "test1": "0, \n0, \n400, \n0, \n0, \n1,\n0,\n0,\n1"
},
If all queries values can be output, it should be:
"test1": "404, \n200, \n400, \n1, \n0, \n1,\n1,\n0,\n1"
I found a same question asked before but no response.
Really don’t know why. Can anyone explain? Is there any solution to output all queries values?
Thanks for help!!!


