Hi All,
Grafana newbie here, I’ve been messing with this problem and couldn’t come up with any solutions.
What I want to acheive
I’m trying to implement a high CPU usage alert, as well as providing the top 3 highest cpu usage processes.
My Parameters
-
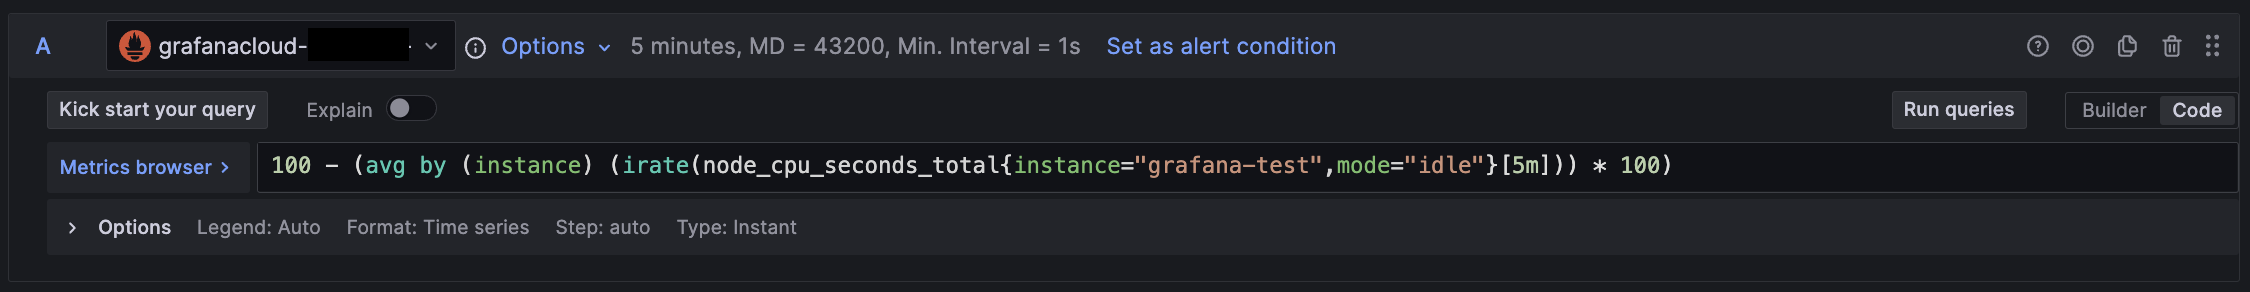
I have query A monitoring an instance called
grafana-test
and query B getting the top 3 highest cpu usage processes usingprocess exporter
-
As for my expressions, I set the threshold as follows, hoping I could get an alert if CPU usage exceeds 70%
-
Here are my annotations


When I stress test my vm to CPU 100%, the alert does trigger, however I am not getting any results from query B.
Some experiments and the results
{{$values}} outputs only A and C: map[A:100 C:1]
{{$labels.B0}} outputs [no value]
Expected Results
Summary: CPU usage at grafana-test has been above 70% for the last 5 minutes
Description: CPU usage: 100%
Top 3 Process
stress-ng: 97.2%grafana-agent: 1.8%google_osconfig: 0.2%
What could be the problem? Thanks!