Hello Community,
I’m setting up Alerting at Grafana 10.1.2
I defined my extraction query.
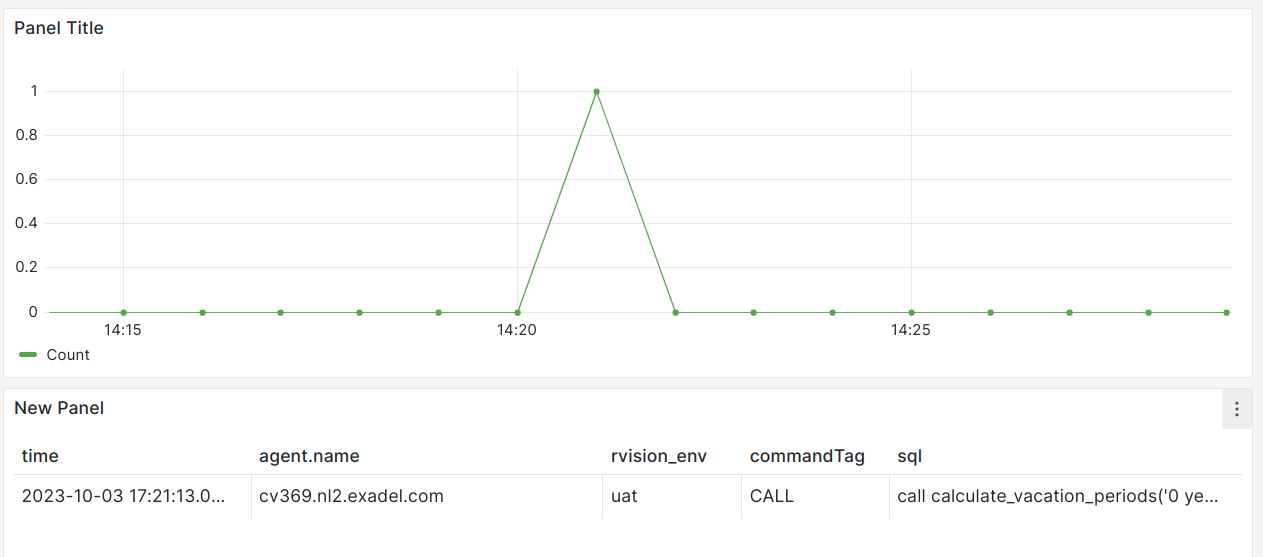
I manged to create Dashboard where I can see the Count graph and Results table.
I managed to create alerting rule where I see exactly the same Count as in my Dashboard and configured Alerting rule to send me notification once query returned some results.
However, I am still unable to add those query results to my messages.
I found three similar posts here (I am limited to post only 2 links here):
Hi George,
Thank you for your answer.
I’ve tried to figure out myself, I’ve tried to read the manuals, I’ve tried to read this forum.
No luck, however.
Hi! What I mean is can you share more information about what you have tried, otherwise it’s really difficult to offer any help. For example a screenshot of your alert rule, including any custom labels and annotations, and screenshot of your notification template (if you have one).
Thanks for the screenshots! Just out of curiosity, where did you get ${@hostname} from? That’s the syntax from legacy alerting which has been deprecated. Did you recently migrate by any chance?
You might have observed that there is no RefID A. That is because in most alert rules the RefID A refers to a query, and since queries can return many rows or time series they are not included in $value .*
Yes! But you have a Reduce expression in B, which reduces all of the data points from your query A. So you can print the value of the query by printing $values.B. You can’t print the value of the query because it doesn’t return a single value, it is a time series query that can return anywhere from 1 to 1000s of data points - depending on the time range and step that has been specified.
Sorry I’m not really sure what you’re getting at but not including values of time series queries is an intentional decision rather than a limitation. Many time series queries can return 1000s of data points, and to avoid users from accidentally making annotations many megabytes in size we don’t allow the printing the results of time series queries, just instant queries and expressions on reduced time series queries.
Server(s) returned some error(s).
We want to warn developers like
for X in 1…length “Your server named AX in environment BX returned error CX with additional data DX”
How to do this using shell script:
curl to Elasticsearch and get result into the variable
“Your server named AX in environment BX returned error CX
What you cannot do is pass all of the data points from a time series query to an annotation (for example the Summary or Description). However you can pass the reduced value (i.e. the number of errors that occurred in the last 5 minutes), the server (AX), and the environment (BX) as both AX and BX would be labels in a multi-dimensional alert rule. I’m not sure what data would be in DX, so I’m afraid I cannot give an answer there without knowing more about the Elasticsearch queries.
My query returned these 3 records for last 10 minutes:
Time
Host
Env
Tag
Sql
Column 6
Column 7
Column N
01:01:01
cv01
dev
CALL
select a from b
you
what
more
01:02:02
cv02
dev
FLUSH
delete from c
name
ever
data
01:03:03
cv03
prod
select d from e
it
is
here
I want:
setup a trigger which raises if count>0 (accomplished);
send a message to dev team like this:
01:01:01 env:dev host:cv01 tag:CALL sql:select a from b
01:02:02 env:dev host:cv02 tag:FLUSH sql:delete from c
01:03:03 evn:prod host:cv03 tag: sql:select d from e
Yes this should be possible. You need to make the env, host, tag and sql columns labels. You should be able to do this in Elasticsearch just with grouping on these columns. If you do that then click Preview alerts, what do you see for the alert instances?
I’m not an Elasticsearch user so I’m not super familiar with Lucene or the Elasticsearch plugin for Grafana.
Could you please elaborate on the grouping on sql columns part?
Also how does the sql label know where to pick the values from? Or in other words the query results from?