Hi experts,
I would like to adjust the X-Axis of Time Series visualizations to a format that is used here (Germany).
It should be the easiest thing of the world and I feel a bit stupid, but I can not manage and can not find much information about it. Some entries here in the forum suggests that it is not possible at all to adjust the format?! It’s hard for me to believe with such an elaborated system as Grafana!
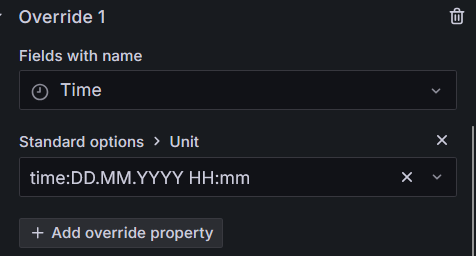
What I have tried is to add an override
But whatever I put behind “time:” - it has no impact on the format of the X-axis.
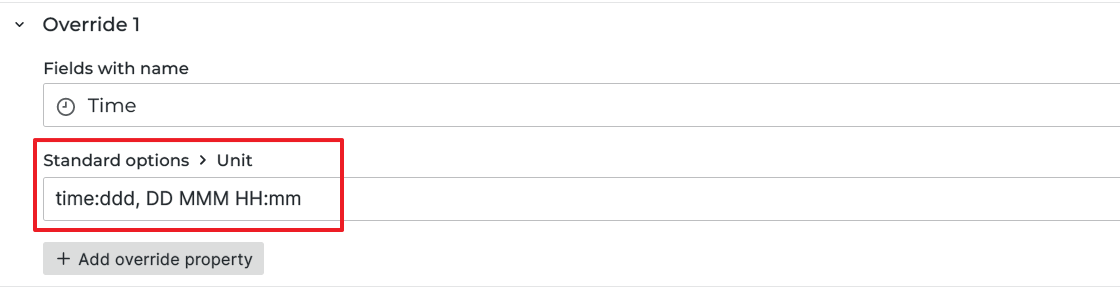
I cannot confirm 100% (due to using an older version G9.5)
but don’t think it is possible to alter the x-as using the ‘Time Series’ panel. (I can remember there have been similar topics with this question). I’m only able to alter the ‘tooltip’ (format) with the override.
In the grafana.ini (actually I use environment variables, since I start Grafana in a docker container), there is a section called date_formats. And - believe it or not - here you can set date formats for the panels.
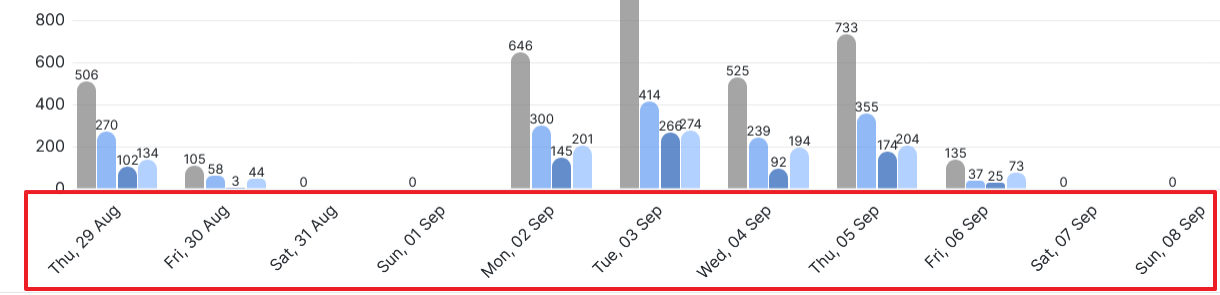
There are several format settings for different time intervals, but for me it worked when I set use_browser_locale to true (was on false). After that (and restarting the Grafana instance) all x-axis captions in the time series where on the correct, in my case German, date / time format!