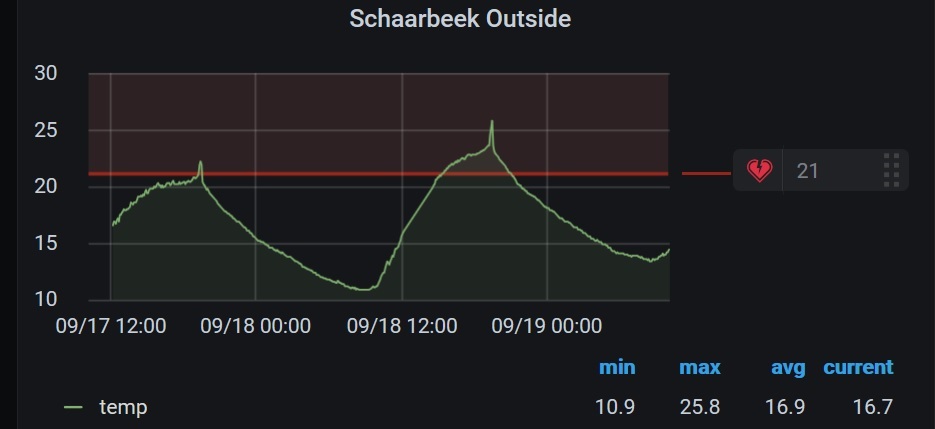
I would like to add a horizontal line ( like the threshold line) but that will stay on the average value ?
How can i implement this ?
Thanks
WoeperBE
There isn’t any support for dynamic thresholds in Grafana yet (hopefully in the future). But depending on which data source you are using it might be possible to draw a line using a query.
For example, if you were using Graphite then it has an aggregateLine function for your use case:
It’s also possible with Prometheus using an Instant Query and a transform: https://grafana.com/docs/grafana/latest/features/datasources/prometheus/#instant-queries
Hi, this is something I’m interested in as well. Do you know how to plot the line for an average value using data from Influxdb 2.0?
I have query A returning data for a graph and query B returning a single row (average for what is used for the graph) which I want to plot as a line on the same graph.
I was hoping for being able to use a dynamic threshold, like setting this as a variable and referencing it in threshold settings, but there seems to be no option for it.
Hello,
I was looking for a solution like this. I found a workaround that works but is a bit dirty 
First, you need to create a variable of the value you want.
Once available, you create a new request on your Dashboard.
You retrieve any value from any datasource and you substract it to itself. It will create you a flat line with the value of 0.
SELECT meanValues + $Variable FROM (SELECT (mean("Value") - mean("Value")) as meanValues FROM "Datasource" WHERE $timeFilter GROUP BY time($__interval) fill(previous))
Then you add your variable value to this result. It creates you the average based on your variable.
I don’t like this solution, but it works.
Hi Paul,
Thanks a lot for this tip, it’s a great workaround to this very old (>4 years I think?) and very annoying problem
(honestly I don’t understand why this feature hasn’t been implemented in Grafana yet, it seems crazy to have to go through such dirty workarounds)
Just a complement from my side, as I didn’t do it exactly the way you suggested.
What I did was I created a variable containing the value I want to display (so far, same as you). In my case this variable is a query that selects the median of a series (I believe this is what you did as well, or something similar e.g. average/mean/etc…). I called it “variable” below.
Then, in my panel, I entered the following query:
SELECT 0*field + $variable FROM […] etc
where “field” is e.g. the field originally displayed in my panel
When I tried to do this without using a variable, Influxdb refused to mix aggregate and non-aggregate functions, so it seems that Grafana re-formats it in an acceptable way for Influxdb when processed as a variable.
Paul, your solution is all the better than it supports nested variables (the variable can itself call upon other variables, and it still works!) and therefore automatically adapts to dynamically varying series - which is how all my dashboards are built.
halo sir , how to chage date format on your graph, in my graph have time format.
now showing 03/18 07:00 , but i want only 03/18.
how to setting sir?
