What happened?
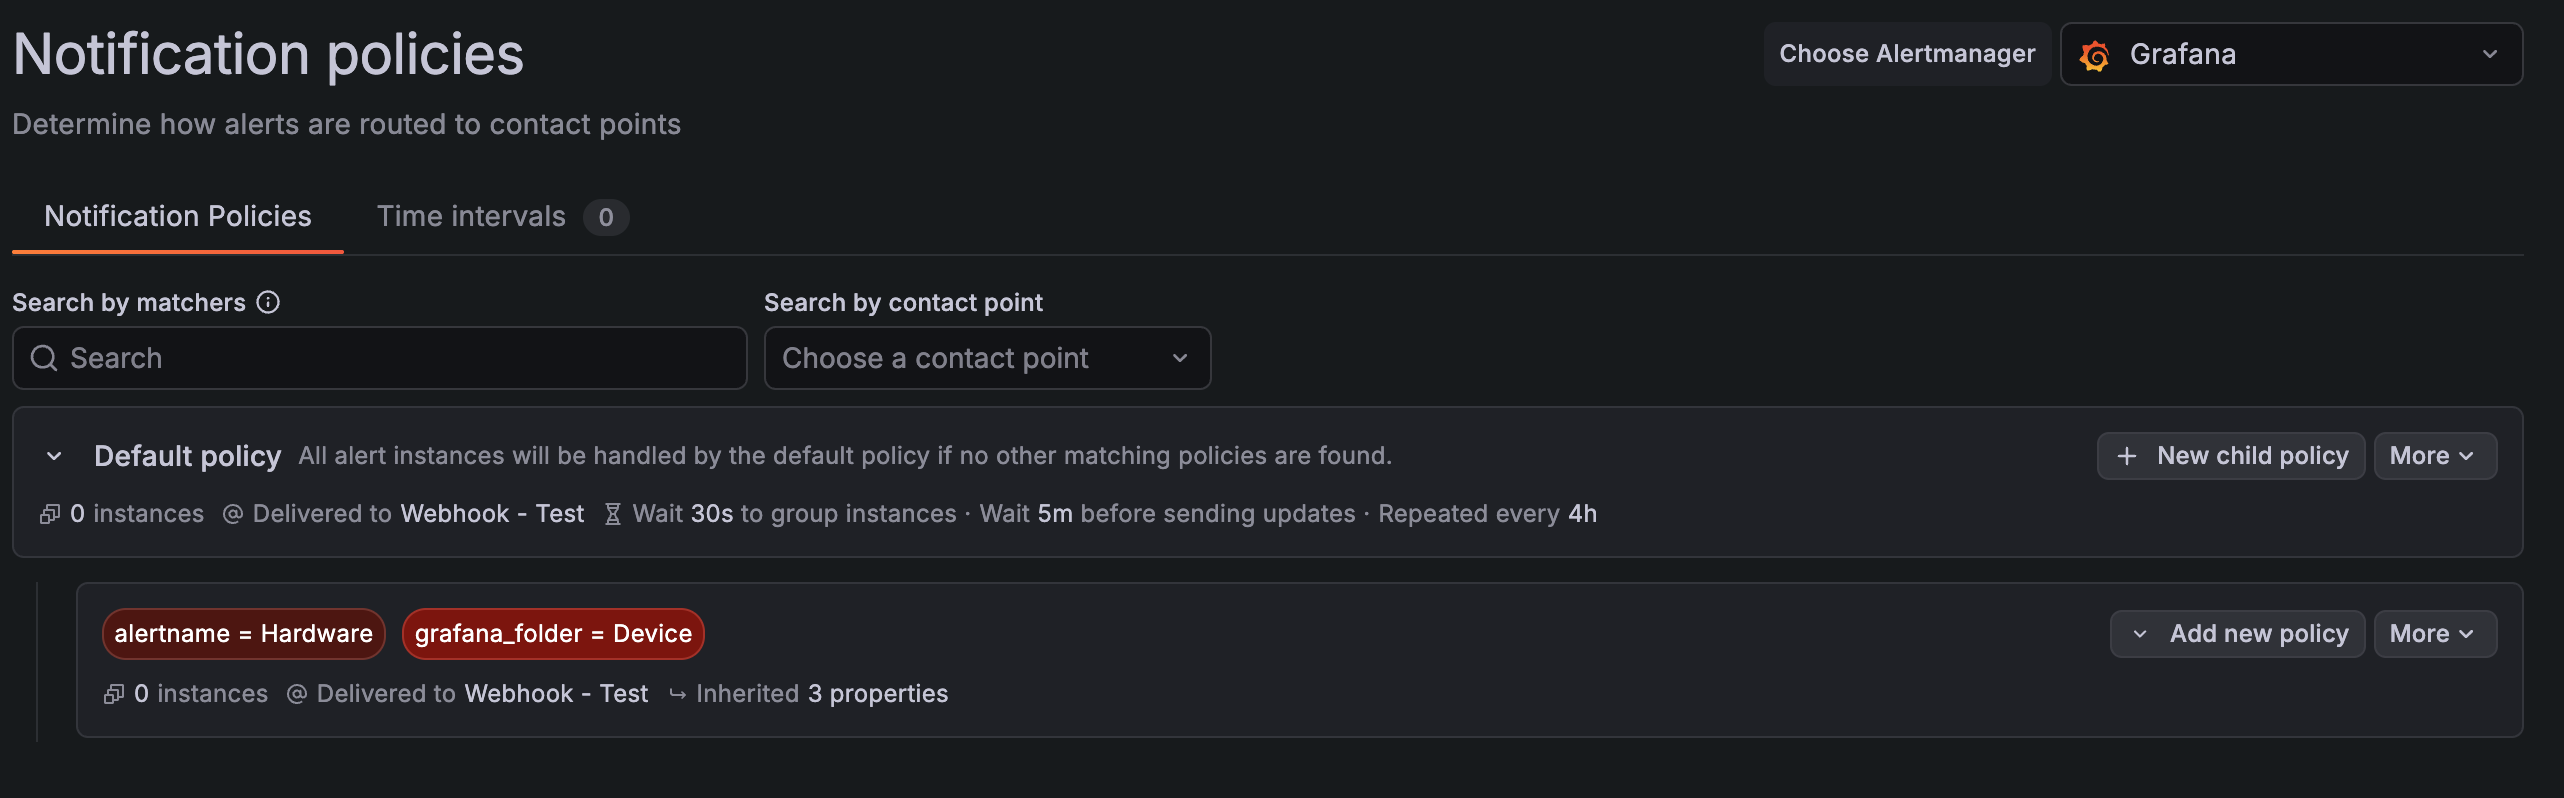
All of the Alerts i set won’t appear on any notification policy, not even the default policy. I’ve also try to remove all alert and follow the alerting documentation step by step.
Previously i was able to setup and run a demo alert that sends to Slack. that no longer works now. Can confirm all alert are firing and not flapping, and contact points are tested to work.
What did you expect to happen?
firing alert should show up in notification policy, but policy shows 0 active instance.
Did this work before?
It worked for the first demo alert i setup, which counts log from cloudwatch and sends alert to slack.
Environment (with versions):
- Grafana version: Grafana Cloud
- Operating system: mac
- Browser: chrome
- Datasource version(s) (prometheus, graphite, etc.): loki cloud, cloudwatch, prometheus cloud.
- Plugins: none
Configuration information:
example alert:
datasource:
type: cloudwatch
uid: deyacfex9f11ce
dimensions: {}
expression: |-
fields @timestamp
| filter ContainerName = "demo_violations"
| stats count() as heartbeat_count
id: ''
instant: true
intervalMs: 60000
label: ''
logGroups:
- accountId: '/redacted'
arn: >-
arn:aws:logs:/redacted
name: /aws/ecs/redacted
matchExact: true
maxDataPoints: 43200
metricEditorMode: 0
metricName: ''
metricQueryType: 0
namespace: ''
period: ''
queryLanguage: CWLI
queryMode: Logs
refId: A
region: default
sqlExpression: ''
statistic: Average
statsGroups: []