Hello,
I am using Grafana agent and build in Dashboard to get apache metrics and logs. Everything is working except the part of the dashboard for showing numbers of each http code groups. What do I need to adjust to get line graph showing codes?
Thank you.

Hey there!
Sorry you are having issues. ![]()
You may need to adjust the time range for the dashboard to see the metrics in question.
The metric for that panel is generated by the logs section of the Grafana Agent Apache integration.
You can see the logs snippet below.
    - job_name: integrations/apache_access
      static_configs:
      - targets:
        - localhost
        labels:
          __path__: /var/log/apache2/access.log
          job: integrations/apache_http
          instance: '<your-instance-name>'
      pipeline_stages:
        - regex:
            expression: '^(?P<ip>[^ ]*) [^ ]* (?P<user>[^ ]*) \[(?P<timestamp>[^\]]*)\] "(?P<method>\S+)(?: +(?P<path>[^ ]*) +\S*)?" (?P<code>[^ ]*) (?P<size>[^ ]*)(?: "(?P<referer>[^\"]*)" "(?P<agent>.*)")?$'
        - metrics:
            response_http_codes:
              type: Histogram
              description: "Apache responses by HTTP codes"
              prefix: apache_
              source: code
              config:
                buckets: [199,299,399,499,599]
The resulting apache_response_http_codes_bucket metric is what is behind that panel.
You can check your Grafana Agent logs to see if the logs component is failing in some way.
A line like the following can confirm you are tailing the logs.
ts=2024-02-23T18:50:50.795154Z caller=tailer.go:147 level=info component=logs logs_config=integrations component=tailer msg="tail routine: started" path=/opt/homebrew/var/log/httpd/access_log
ts=2024-02-23T18:50:50.808989Z caller=tailer.go:147 level=info component=logs logs_config=integrations component=tailer msg="tail routine: started" path=/opt/homebrew/var/log/httpd/error_log
A promql query for the bucket metrics can be used to verify that log entries are being counted.
apache_response_http_codes_bucket

1 Like
Thanks @peterolivo,
I managed to get metrics by adjusting regex expression.
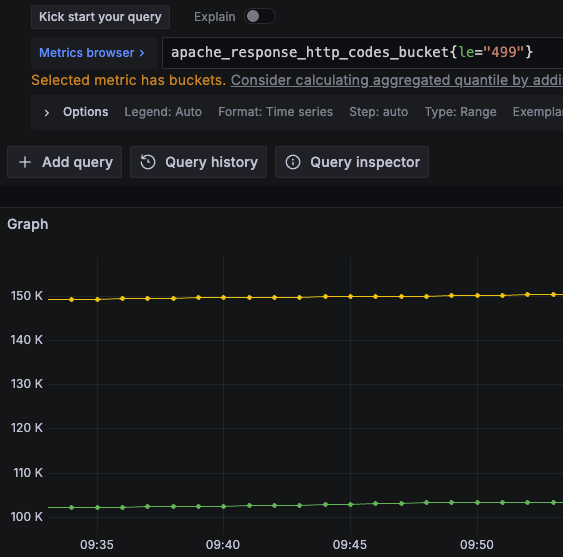
But now Grafana panel doesn’t look right, it shows almost the same amount of all status codes when it should be mostly 200s:

There is an open issue also: Apache HTTP codes histogram is not displayed correctly · Issue #985 · grafana/jsonnet-libs · GitHub
EDIT:
I added code label to config to be able to filter loki logs and it looks it’s showing correctly the numbers.
        - labels:
            method:
            code:
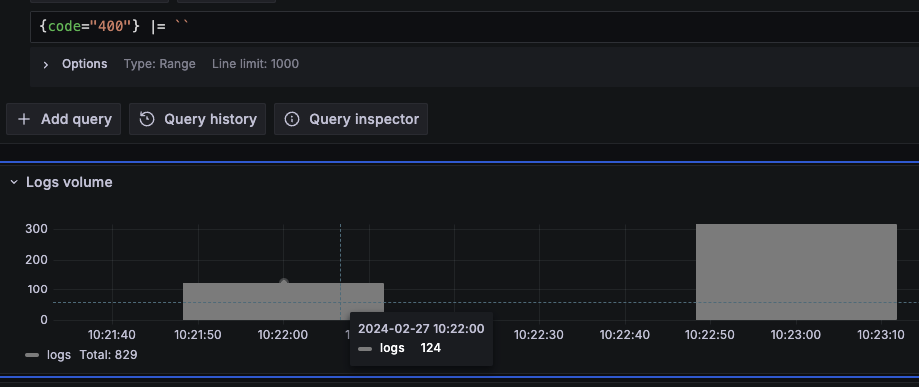
And when I query actual metrics, it’s not summed correctly.
Thank you for your help!