Latest version of Grafana: Grafana v10.0.2 (b2bbe10fbc), on Ubuntu.
I am trying to duplicate this (from Zabbix):
How Using Grafana Dashboards
I was pointed this way by a member on the Zabbix forums.
My issue is I have a subset of my devices which cannot be queried by SNMP and I can’t get an agent on them. The only way I have of testing availbilty is via ICMP Ping - so I have 3 stats per device to play with:
ICMP Loss (0-100%)
ICMP Ping (Up or Down)
ICMP Ping Response tim (in ms)
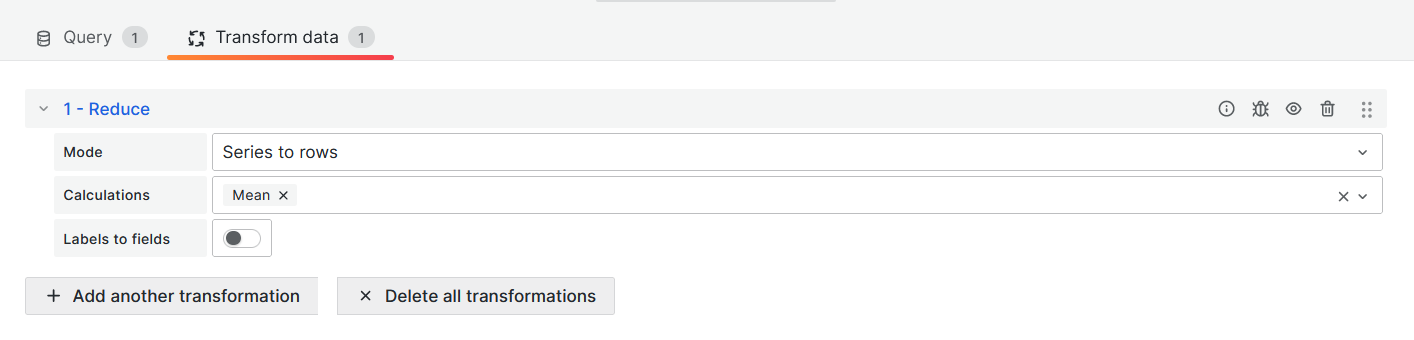
How can I use Grafana to duplicate this dashboard element? I’m guessing I’m going to have to do a query to group the number of devices with each availability level, as well as doing some sort of transformation (from e.g. Loss to Available being 0-25%, Not available being 75%+, and issue being 26-74%), but I don’t know WHERE to start in Grafana.
TBH the heatmap would be good, if I could just get it to not worry about history but just do current status (is this possible).
Gives me something like what I am looking for…If I could pin it to this time (filtered by left hand column) and get rid of the middle colume (I’m not sure where that is from)…
Hello Argon0
In this case, it is better to create a script or a calculated item in zabbix to have these statistics, in this case you can add or calculate them as needed.
In your last print, you can work with override and hide the fields with the names you need
I did follow the step and looks great, but there is something on my query that i’m not understanding: On my envoriment now i got just one High Severity Problem but Grafana its showing me 4, when i got 2 it shows me 7 and so on. Is there anyone with the same difficult?
@andrecampos there’s some issues on environments with hosts in maintenance status, because the query mode Triggers don’t have options to filter suppressed alerts out.
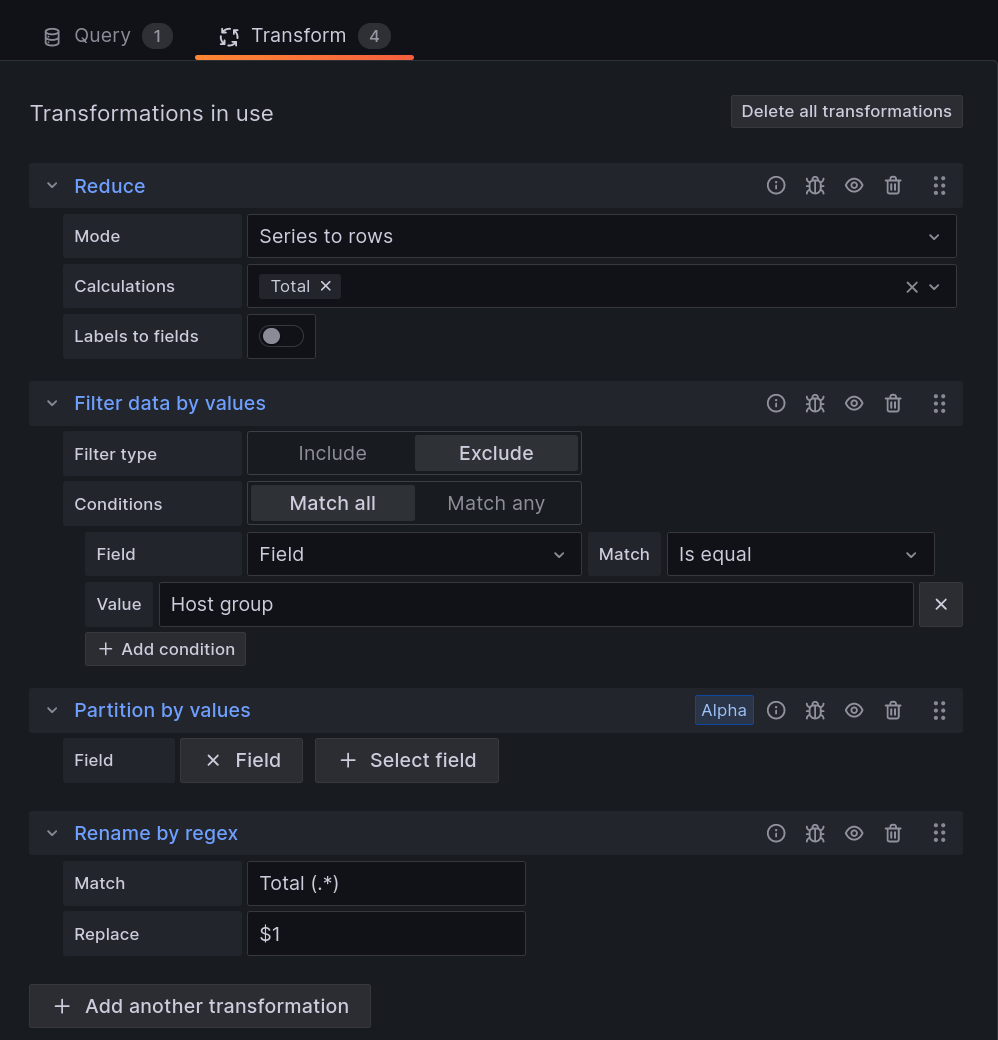
You could achieve something by playing with Query Mode Problems and using the JSON that it got with some transformations by using Extract Fields first.
Hi Isaque, i’ve inspect the query and understood whats happening here. We use groups to organize the hosts on Zabbix Server, so this host belongs to 4 differents groups and thats why it shows me 4 alerts for HIGH. The AVERAGE host thats its showing belong to one group, thats why this is correctly. Now i have to create someway to Grafana do not calculate all alerts from all groups like this. Any Suggestions?
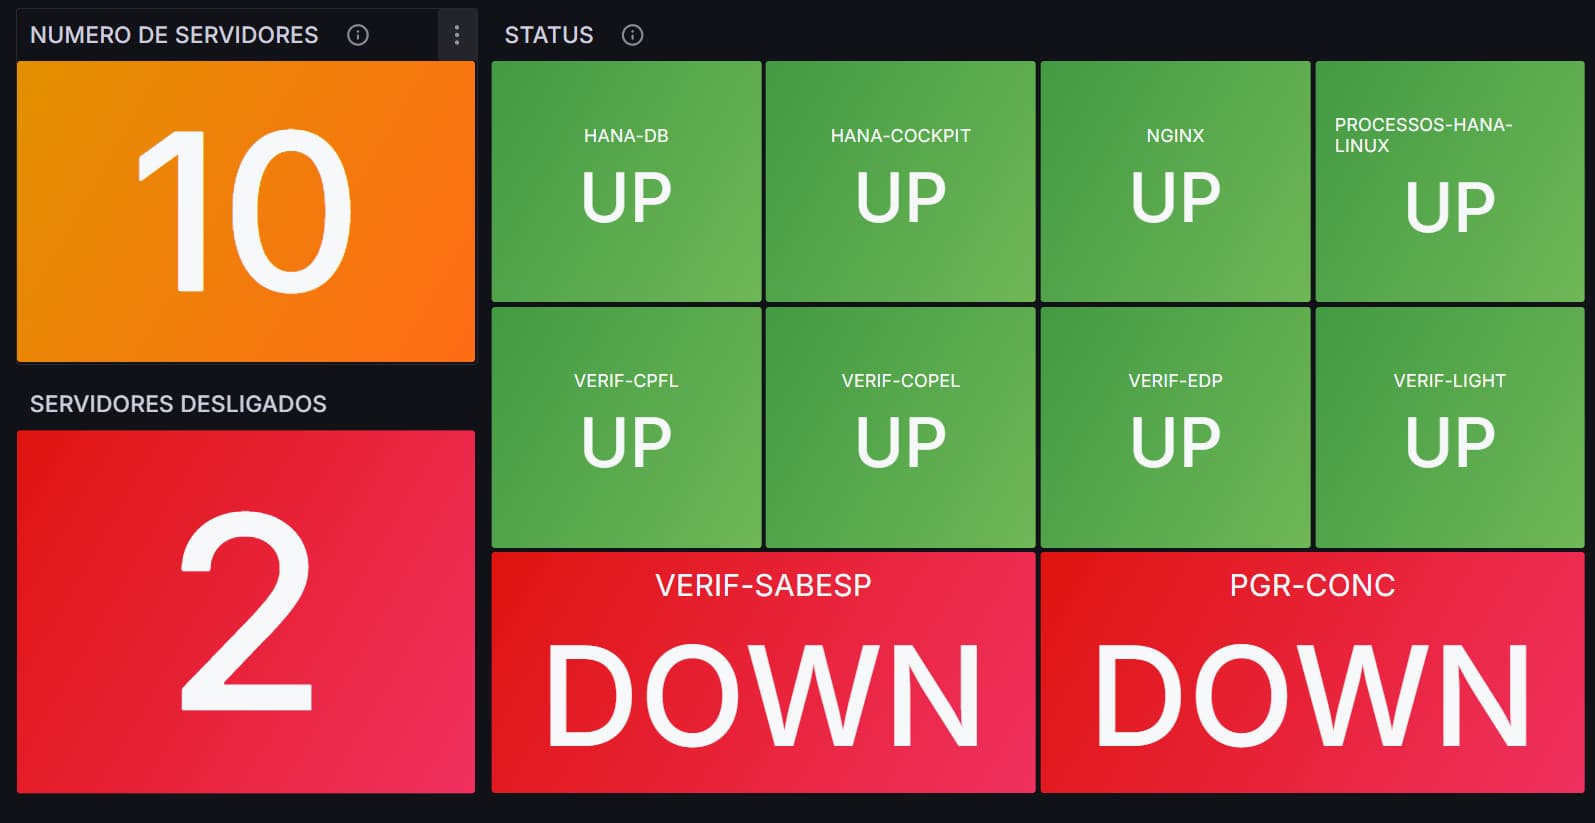
I created a script that uses fping to test the availability of each host on my network, it responds with available or unreachable, this way I filter the output with grep and wc, thus obtaining the number of available and unreachable hosts, throwing the output to a .txt file and then putting it in cron to run every 3 minutes.
crontab to filter unreachable hosts:
*/3 * * * * /root/instances_down.sh |grep -i unreachable | wc -l > /tmp/down.txt
After that, just create an item in Zabbix (vfs.file.contents[file,]) and that’s it…just import it to Grafana…for available hosts, just change the script.