Hi, I´m using Grafana in home assistant and my database is influxDB.
Hello,
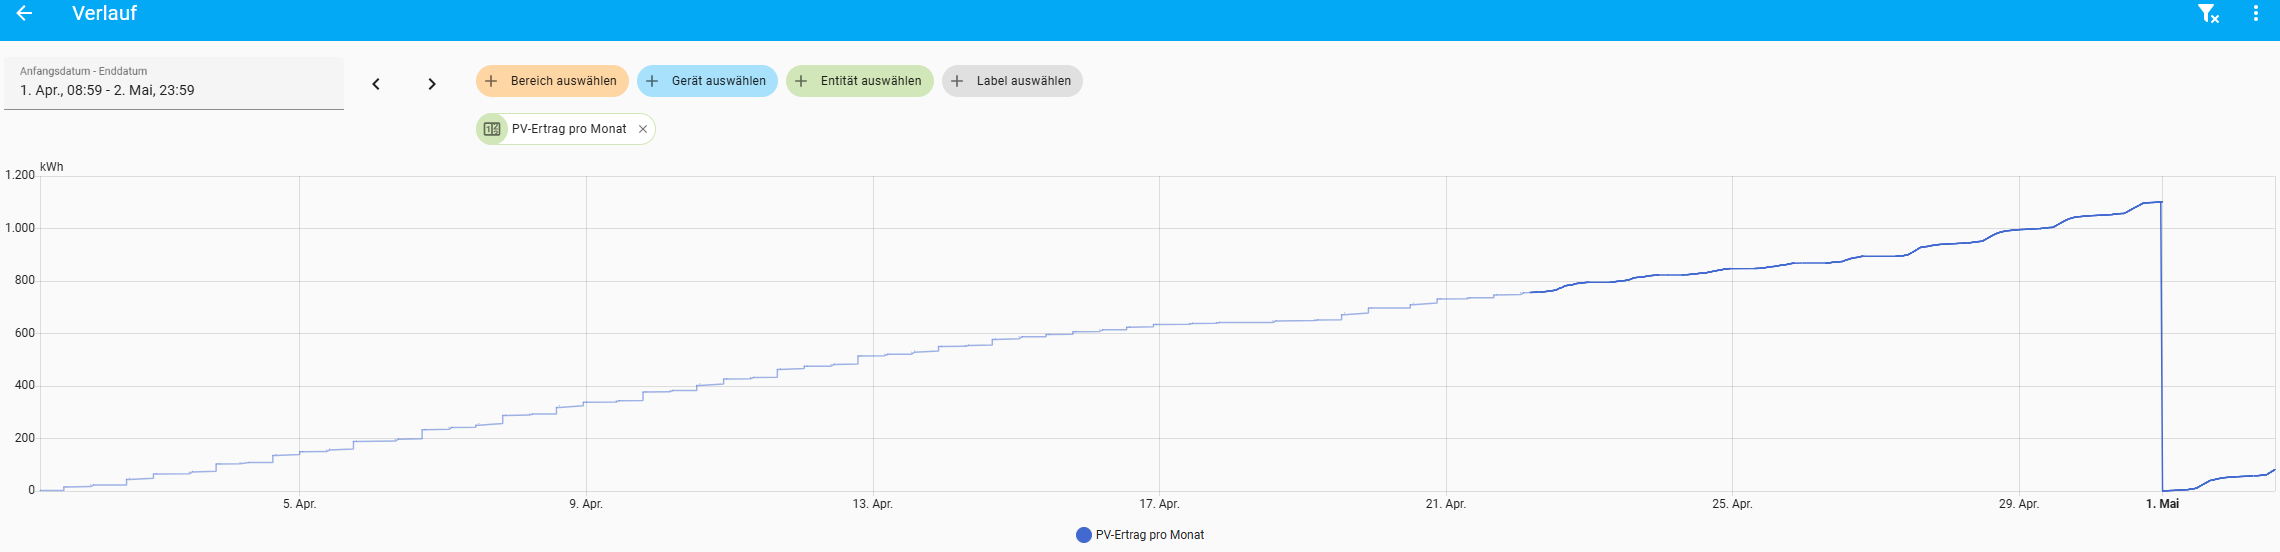
I have created various evaluations in Grafana that show me monthly values using bar charts. The values are also correct.
However, my problem is that I only get the current month displayed from about the middle of a month and until then no bar is displayed for the current month. When I call up the corresponding helper in HA, the value is there correctly, but nothing is displayed in Grafana.
What could be the reason for this?
Switch to Text Editor
use this query
SELECT
max(“value”)
FROM “kWh”
WHERE
“friendly_name” = ‘PV-Ertrag pro Monat’
AND $timeFilter
GROUP BY
time(30d)
fill(previous)
$timeFilter: Grafana automatically replaces this with your dashboard’s time range.
fill(previous): Tells InfluxDB to fill incomplete monthly buckets with the last known value (so the current month always appears).
I don´t think there will be any difference, but actually I can´t test it, as I said in my post before.
I the past I did some testing with different option there, but nothing worked