Inconsistent Display stacked bar Chart

Hi,

I am encountering a display inconsistency when trying to display a stacked bar chart with two series (two positives and two negatives) depending on the time window selected.

The target is to have a time window of “Today so far”.

Doing so, some series won’t display: Two series missing

Selecting a shorter window consistently display such as Last 3h.

Out of the longer durations, last 24h and last two days displays correctly consistently, Last 6h, Last 12h, Today and Today so far do not.

For longer time windows, the display is sporadically inconsistent.
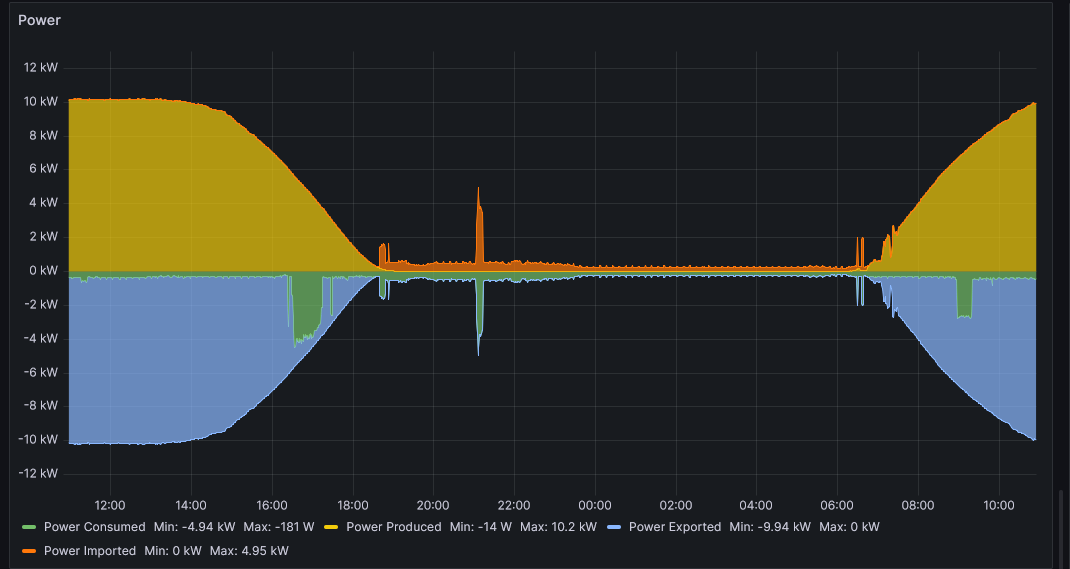
I can get the expected “Today so far” output sometime by increasing progressively the time window: Expected output but refreshing the graph would stop showing some of the series.

  • What Grafana version and what operating system are you using?

Grafana v10.1.5 (849c612fcb) through docker compose
Ubuntu 22.04.3 LTS

Welcome @matthieurosset to the Grafana forum.

Can you please share your datasource, your queries, and the raw data produced (you can download as .csv and post here)?

Thanks!

The Datasource is from an InfluxDB 2 bucket.

The query is:

from(bucket: “HomeAssistant”)

|> range(start: 2023-10-22T13:00:00Z, stop:2023-10-23T00:10:18.872Z)

|> filter(fn: (r) =>

(r.entity_id=="envoy_122308076867_current_power_consumption" or r.entity_id=="envoy_122308076867_current_power_production" or r.entity_id=="grid_export_power" or r.entity_id=="grid_import_power" ) and

r._measurement=="kW"

and r._field=="value"

)

|> keep(columns: [“_time”, “entity_id”, “_value”])

|> aggregateWindow(every: 1m, fn: last)

|> pivot(rowKey:[“_time”], columnKey: [“entity_id”], valueColumn: “_value”)

|> map(fn: (r) => ({_time: r._time, “Power Consumed”: - r.envoy_122308076867_current_power_consumption, “Power Produced”: r.envoy_122308076867_current_power_production, “Power Exported”: -r.grid_export_power, “Power Imported”: r.grid_import_power}))

and here is the raw data

Without doing anything to the Grafana container or configuration, the same graph is now correctly rendering consistently for all time windows outside of editing mode…

No clue why this was not working properly earlier today on all browsers (Firefox, Chrome, Mobile).

I have now experimented with a stacked Time Series chart with filled below that looks cleaner for a similar result. This type of chart was also borked earlier today, somehow.

Edit:

Looks like the issue might have to do with holes in the data, as if I insert : |> fill(usePrevious: true), the display is again missing some series on and off for some of the time windows.

Without understanding too much about your application, is the above normal, i.e. should there be periods of time when a blank value exists for any given field? If no, then the problem probably lies in your data capturing method.

Hi,

Data is coming from home assistant and the sensors may not publish perfectly consistency.

The holes in the data could be a red herring.

I have done some more tests with the Time series visualization which exhibits the same inconsistent behaviour.

It appears that the issue is caused purely by the Stack options with series being both positive and negative. For some time windows, some series even change signs for some reasons while others disappear:

Here is the reference series without stacking:

My expectation would be for stacking to stack the negative orange series together so that it mirrors the Blue positive series.

The issue only happens for some time windows: 12h, Today so far. For example last 24h does display the intended stacked output consistently:

The issue is very inconsistent.

Without changing anything, now all time windows renders inconsistently as soon as Stacking is ticked off.