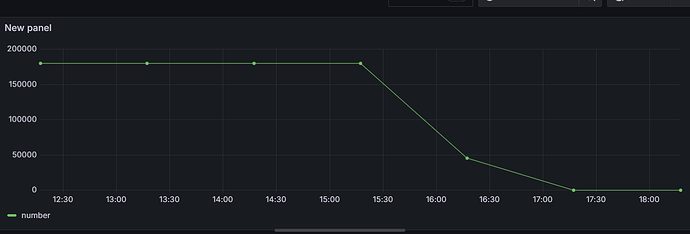
I have a postgres database, with a time stamp field. Each row in the table is one transaction. We have thousands of transactions per second. I have gotten close with the x axis showing 1 hour grouping. I now want to have the y axis show how many transactions are in the hour group.
SELECT
$__timeGroup(attachtime, ‘1h’),
count(transid) as number
FROM rogerswork Where $__timeFilter(attachtime)
GROUP BY 1
ORDER BY $__timeGroup(attachtime, 1h);
Hello @bradtaylor ,
You can resolve this issue by following these steps:
Step 1. Create dummy data in PostgreSQL that includes timestamp-based records.
Step 2. Add PostgreSQL as a data source in Grafana.
Step 3. Use the following panel query to count transactions per hour:
WITH hours AS (
  SELECT generate_series($__timeFrom(), $__timeTo(), interval '1h') AS bucket
)
SELECT
  hours.bucket AS time,
  COALESCE(COUNT(r.transid), 0) AS number
FROM hours
LEFT JOIN rogerswork r
  ON r.attachtime >= hours.bucket
  AND r.attachtime < hours.bucket + interval '1 hour'
GROUP BY hours.bucket
ORDER BY hours.bucket;
Step 4. In Grafana, set the visualization type to Time series.
Final output :-
Hi @bradtaylor
Just checking in—did this solution resolve your issue, or are you still facing the same problem?
I no longer have this problem

