Hi,
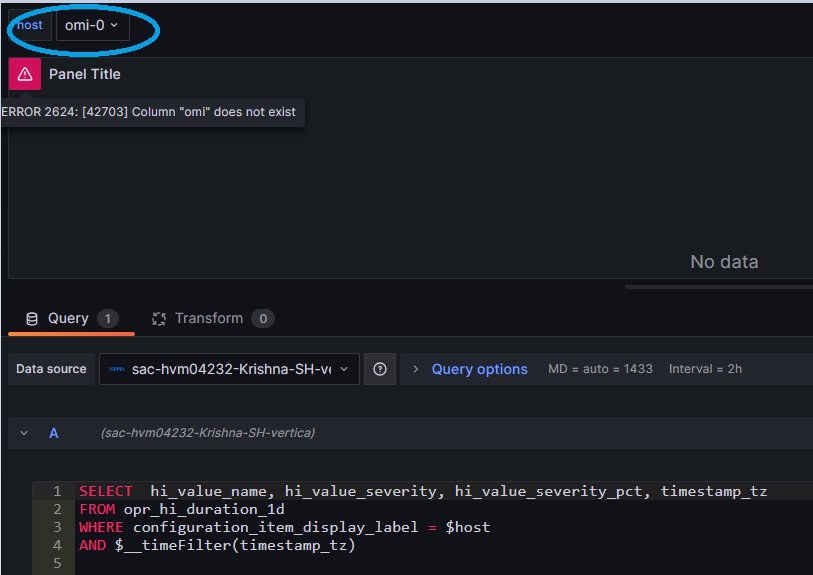
I am trying to create a simple dashboard, with a table to show the output of a query that uses a variable. I am connecting to a Vertica database. However, I get an error indicating that Grafana is interpreting the selected value of the variable as a column name. Please see the details below, including the screenshot, which shows the query I’ve defined.
-
What Grafana version and what operating system are you using? 10.1.2
-
What are you trying to achieve?
Trying to create a dashboard with a variable and time filter -
What happened?
I get an error that suggests that Grafana is using the selected value of the variable as a column name. -
What did you expect to happen?
The query should match the values of a column, configuration_item_display_label, to the selected value of the variable $host -
Can you copy/paste the configuration(s) that you are having problems with?
Thanks
-Ankit
