- GRAFANA VERSION?
Grafana v12.0.1 (80658a73c5)
- What are you trying to achieve?
- I would like to have to variable as an option inside the dashboard, one for “Clientes” (customers) and the second one for “Hosts”… Specifically I would like to select any Customer from the variable “Clientes” and if a select a specific name I want to see just all hosts from that customers in special in the variable “Hosts”.
- How are you trying to achieve it?
At the moment I have two variable.
1.- First One
Name: Cliente
Label: Cliente
Data source: SIXMANAGER_clientes-servidores_Windows-1
Query:
import "influxdata/influxdb/schema"

schema.tagValues(
  bucket: "SIXMANAGER_clientes-servidores_Windows-1",
  tag: "cliente"
)
Selection Options:
- ✓ Multi-value
- ✓ Allow custom values
- ✓ Include All option
Preview of values:
- All
- Imantof (Municipalidad de Antofagasta)
- Labocenter
2.- Second One
Name: Host
Label: Host
Data source: SIXMANAGER_clientes-servidores_Windows-1
Query:
import "influxdata/influxdb/schema"

schema.tagValues(
  bucket: "SIXMANAGER_clientes-servidores_Windows-1",
  tag: "host"
)
Selection Options:
- ✓ Multi-value
- ✓ Allow custom values
- ✓ Include All option
Preview of values:
- All
- Cejar
- Chaxa
- ChiuChiu
- DC-DNS
- MMRAD
- Miscanti
- SRV-BD-RISPACS
- SRV-RISPACS
- Salar
- WIN-01PHIGA5SPE
- WIN-A0HQQF18AMN
- WebExamanesINTERNO
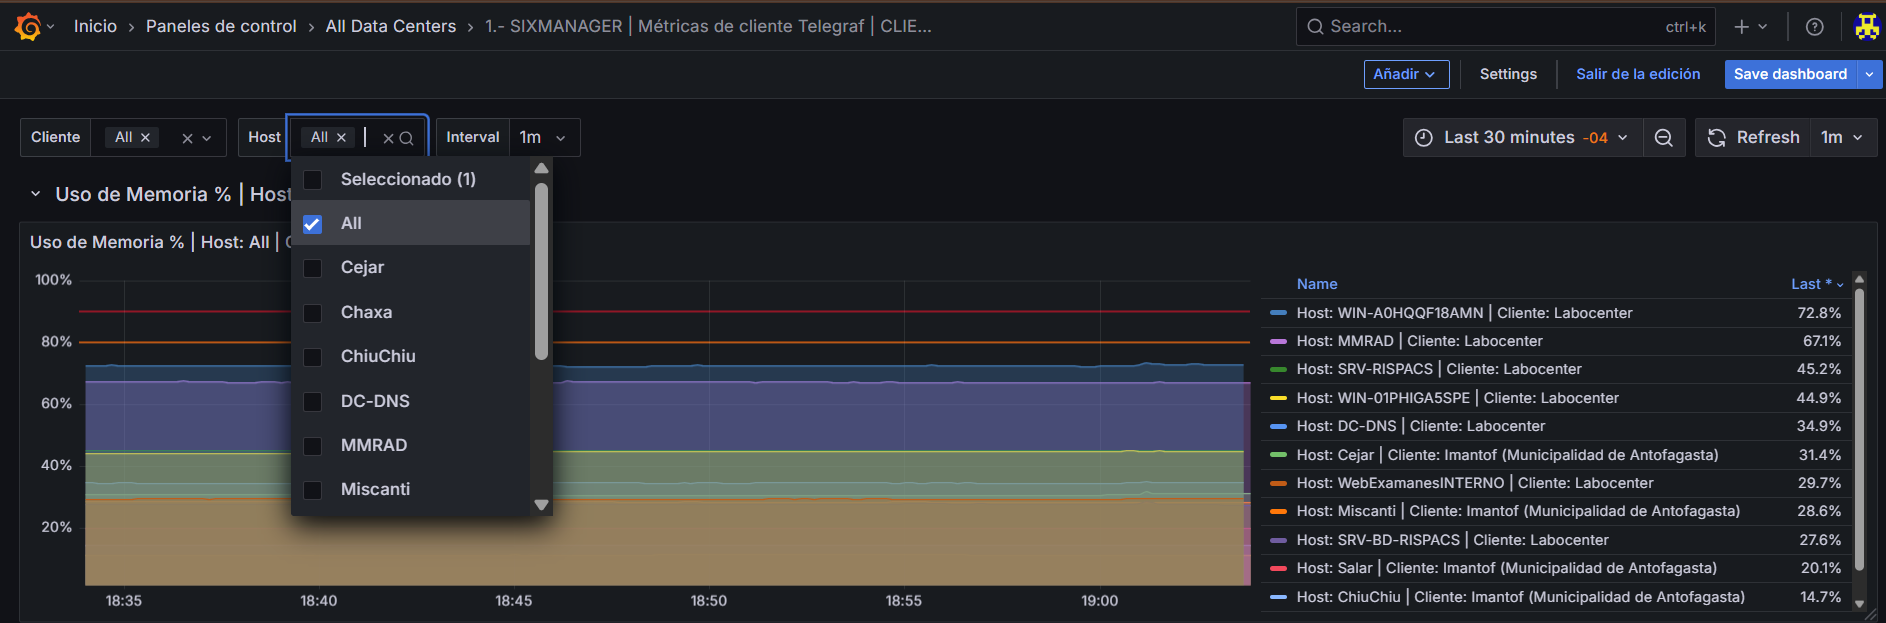
- What happened?
Basically, when I select a specific customer, for example ‘Labocenter’, I still can see all servers, I mean, it supposed to show just the servers that are from that customer and not all servers… I would like to select one and then in the another variable (Host), to see just the servers that are from that customer, in this case:
- WIN-A0HQQF18AMN
- MMRAD
- SRV-RISPACS
- WIN-01PHIGA5SPE
- DC-DNS
- WebExamanesINTERNO
- SRV-BD-RISPACS
- Can you copy/paste the configuration(s) that you are having problems with?
I am using this query for a dashboard, just as an example:
from(bucket: "SIXMANAGER_interno-servidores_Windows-1")
  |> range(start: v.timeRangeStart, stop: v.timeRangeStop)
  |> filter(fn: (r) => r["_measurement"] == "mem")
  |> filter(fn: (r) => r["_field"] == "used_percent")
  |> filter(fn: (r) => r["cliente"] =~ /${Cliente:regex}/)
  |> filter(fn: (r) => r["host"] =~ /${Host:regex}/)
  |> aggregateWindow(every: v.windowPeriod, fn: mean, createEmpty: false)
  |> yield(name: "last")


Please guys help me I am new here and I need to show this to my bosses ![]() soon!
soon!