Hi,
Is there a way to use dashboard variables in a TraceQL expression?
Hi,
Is there a way to use dashboard variables in a TraceQL expression?
I’d love to know as well, I haven’t found a way to do it. And it’s a shame because it would be a really useful feature to have, as it would allow creating dashboards with infos like a list of slow queries per applications for example
This should be possible. For example, using {.http.method = "${method}"} and having a custom variable method you can control the query with that variable. Maybe there is some specific usecase that does not work as it should?
I’ve been trying to expand a dashboard variable inside a TraceQL query, but I can’t manage to make it work either.
I’ve defined a dashboard variable called “contentSource” with a few different options.
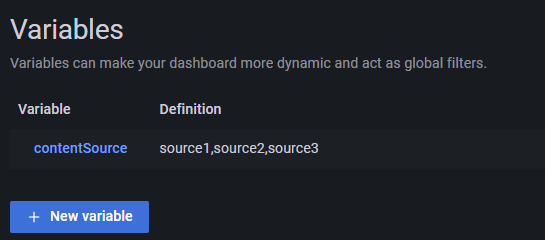
After that, I created a Table panel where this variable needs to be used in a TraceQL query.

In the screenshot, I used the syntax you suggested in your earlier answer, but it doesn’t seem to expand the variable properly. Using the query inspector, you can see that it simply sends the “${contentSource}” string URL-Encoded:
url:“api/datasources/proxy/2/api/search?q=%7B.contentSource%3D%22%24%7BcontentSource%7D%22%7D&limit=20&start=1677052867&end=1677074467”
I also tried the other syntax options for dashboard variables like $contentSource, but none seem to do the trick.
how about something like this?
~"$contentSource"
That sadly does not work either.
I’ve tried all the variable syntax options as described in Variable syntax | Grafana documentation
That means:
{.contentSource = “$contentSource”}
{.contentSource = “${contentSource}”}
{.contentSource = “${contentSource:text}”}
{.contentSource = “[[contentSource]]”}
All of these sadly have the same effect: the variable is not expanded, which I checked via the Query Inspector.
I couldn’t find anything in the TraceQL documentation about using variables - the only useful result I found is this thread.
Are variables simply not supported in TraceQL or am I doing something wrong?
Since there seems to be no documentation, time to start hacking!
{.contentSource = '${contentSource:percentencode}' }

or

{.contentSource = ${contentSource:percentencode}}
are you doing this in a time series visualization?
This is for a Table panel, but the result is the same for any panel type.
I’ve tried your suggestions, but sadly they don’t work either.
I’ve also tried just the variable without any surrounding code (in all of the usual valid variable syntaxes) - which also doesn’t expand it.
Thanks for your suggestions, but it looks like there isn’t a way to make this work.
What if you used apache echart grafana plugin for this.
It has a table viz but you have more control, via javascript/typescript, manipulating data.
Const url = 'api/contentSource' + contentSource;


/**
 * Fetch
 */
fetch(url, {
  method: 'GET',
  headers: {
    'Content-Type': 'application/json',
    'PRIVATE-TOKEN': '$token',
  }
})
  .catch((error) => {
    console.error(error);
  })
  .then(async (resp) => {
    const body = await resp.json();
    console.log(body);


  });
Kind of thing as a last resort. Maybe worth trying
@mikhailvolkov is the awesome dev behind this plugin
As @aocenas said, this should be possible. If it doesn’t work in your version of Grafana, try updating to the latest version and trying again. I tested with version v9.4.0 (currently in beta, should be released soon) and it works great.
Thanks a lot for that - I was trying it in the latest release version, 9.3.6.
In the docker image “grafana/grafana-dev:9.4.0-102483pre” the variable is expanded properly.


