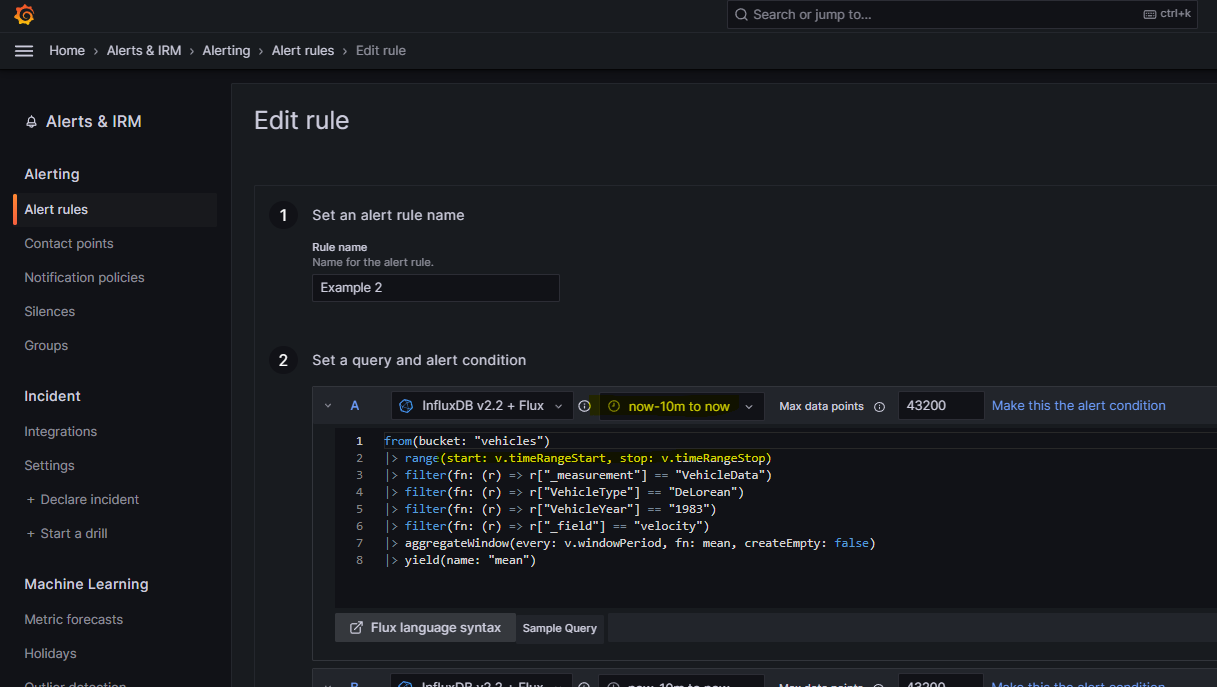
When defining an alert query in InfluxDB Flux script I use:
range(start: v.timeRangeStart, stop: v.timeRangeStop).
When I test the alert in the editor it works as expected.
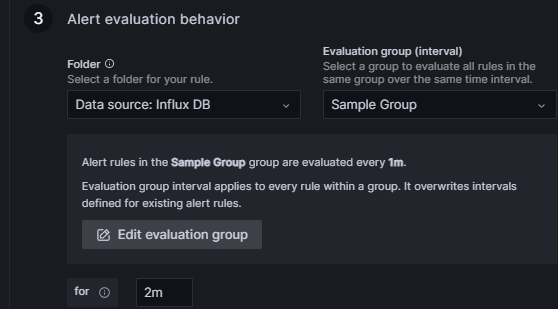
However: The resulting alert doesn’t work in “normal” mode. (It always evaluates to health:“nodata”).
Example: “range(start: v.timeRangeStart, stop: v.timeRangeStop)” with a selected time-period of “now-3h to now” results in health “nodata” whereas range(start: -3h, stop: now()) results in a working alert (however: In the alert editor the query result will display an error now (“Data outside time-range”) with a button “zoom to data” that doesn’t work.
Again: While editing the alert using “range(start: v.timeRangeStart, stop: v.timeRangeStop)”.everthing works fine. The selected time-range is reflected in the query result graph and the alert test works.
I suspect that v.timerangeStart -Stop are not working properly when not in the alert editor.