It is probably a super newbie question, but I can’t figure out the solution.
I just installed Grafana and added my Prometheus source.
Then I imported a couple of dashboards (405 & 1860).
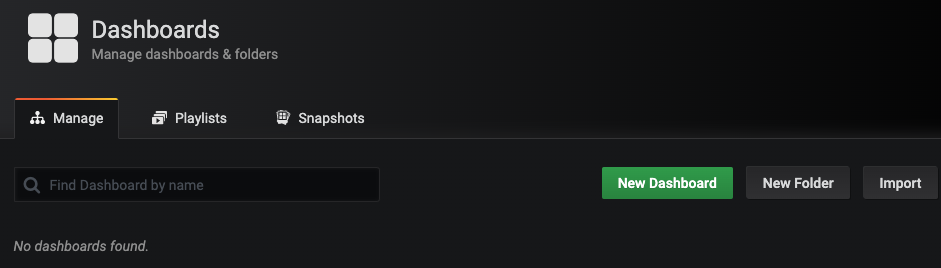
Surprisingly, when I go to the dashboards, they do not appear:
I also tried to save them under a different name: without success.
They only appear when I go back to the home page, under the recently viewed dashboards:

What did I do wrong?
How do I make those 2 dashboards appear in the list of dashboards?
How can I setup Grafana to use one of the two as landing page?
Thanks in advance for your help,
Emmanuel
