-
What Grafana version and what operating system are you using?
- I am using grafana cloud.
-
What are you trying to achieve?
- i am trying to achieve the following 2 things using timeseries panel:
- Show the trend of successful/failures of github actions over time.
- Their should be two dropdowns, one is reponame and another is image name, based on the selection of reponame, the corresponding image name should appear, post selection of both reponame and imagename, the trend should be plotted.
- i am trying to achieve the following 2 things using timeseries panel:
-
How are you trying to achieve it?
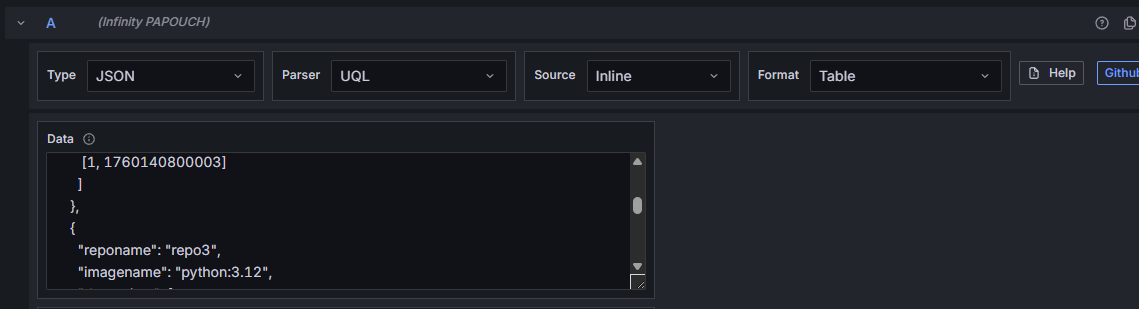
- I am formulating a json to pass to infinity data source as mentioned below
- where status 0 is successful, status 1 is failure, along with the status i am passing the timestamps during successful/failures in unix format.
- Also please review and advice if i my JSON format is aligned to my requirements so that i can plot the trend ?
-
{
  "record": [
    {
      "reponame": "repo1",
      "imagename": "python:3.10",
      "datapoints": [
       [1, 1730140800000],
       [0, 1740140800001],
       [1, 1750140800002]
      ]
    },
    {
      "reponame": "repo2",
      "imagename": "python:3.11",
      "datapoints": [
       [1, 1730140800000],
       [0, 1740140800001],
       [1, 1750140800002],
       [1, 1760140800003]
      ]
    },
    {
      "reponame": "repo3",
      "imagename": "python:3.12",
      "datapoints": [
       [1, 1730140800000],
       [0, 1740140800001],
       [1, 1750140800002],
       [1, 1760140800003],
       [1, 1770140800004]
      ]
    },
    {
      "reponame": "repo4",
      "imagename": "python:3.13",
      "datapoints": [
       [1, 1730140800000]
      ]
    },
    {
      "reponame": "repo5",
      "imagename": "golang:1.24",
      "datapoints": [
       [1, 1730140800000],
       [0, 1740140800001],
       [1, 1750140800002],
       [1, 1760140800003],
       [1, 1770140800004]
      ]
    }
  ]
}
-
What happened?
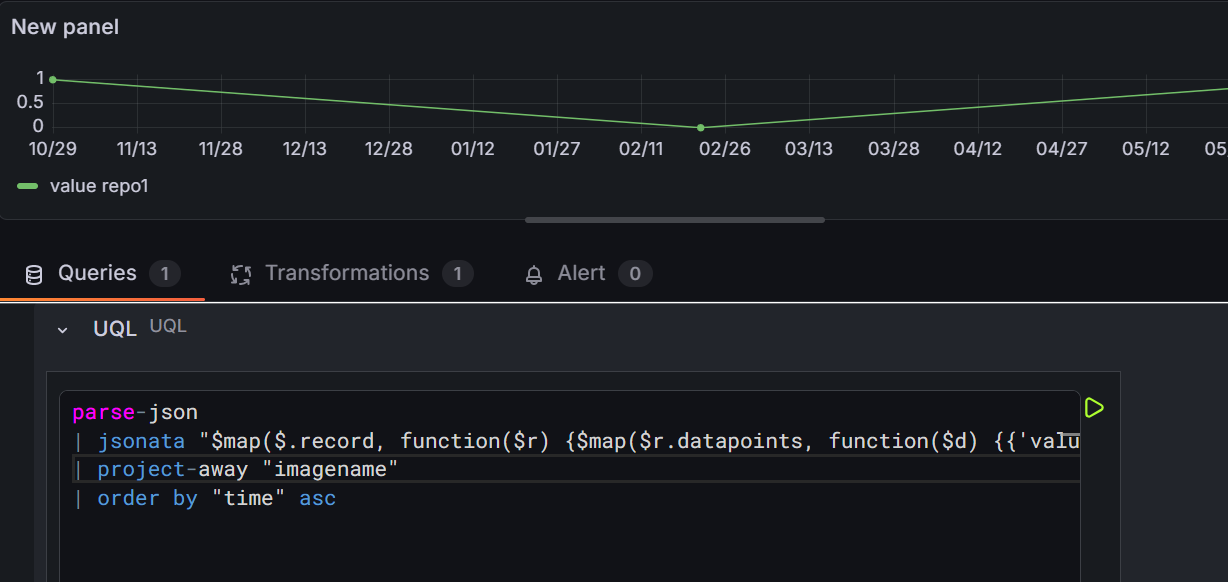
- Having problems in parsing the JSON using JSONata, unable to return the results, is it something that i should use UQL to accomplish it ?
-
What did you expect to happen?
- It should plot the trend of status of github actions over time in 2 lines one for success and one for failure.
-
Can you copy/paste the configuration(s) that you are having problems with?
- Repo name (reponame) variable.
-
$distinct(record.reponame) - Image name (Imagename) variable.
-
( $repo := "${reponame}"; $repo = ".*" ? $distinct(record.imagename) : $distinct(record[reponame = $repo].imagename) - Infinity Query:
-
(
  /* Filter by selected repo and image */
  $repo := "${reponame}";
  $image := "${imagename}";

  /* Filter records */
  $filtered := $repo = ".*" ? record : record[reponame = $repo];
  $filtered2 := $image = ".*" ? $filtered : $filtered[imagename = $image];

  /* Flatten datapoints array into time series format */
  $filtered2.{
    "target": reponame & " - " & imagename,
    "datapoints": datapoints
  }
)
-
Did you receive any errors in the Grafana UI or in related logs? If so, please tell us exactly what they were.
- In Grafana UI it says, their was a problem in parsing the JSON and unable to return the results
-
Did you follow any online instructions? If so, what is the URL?


Thank you so much @expoenergy , let me try this one.

Thanks @yosiasz , @expoenergy for all the inputs, i am taking a look.
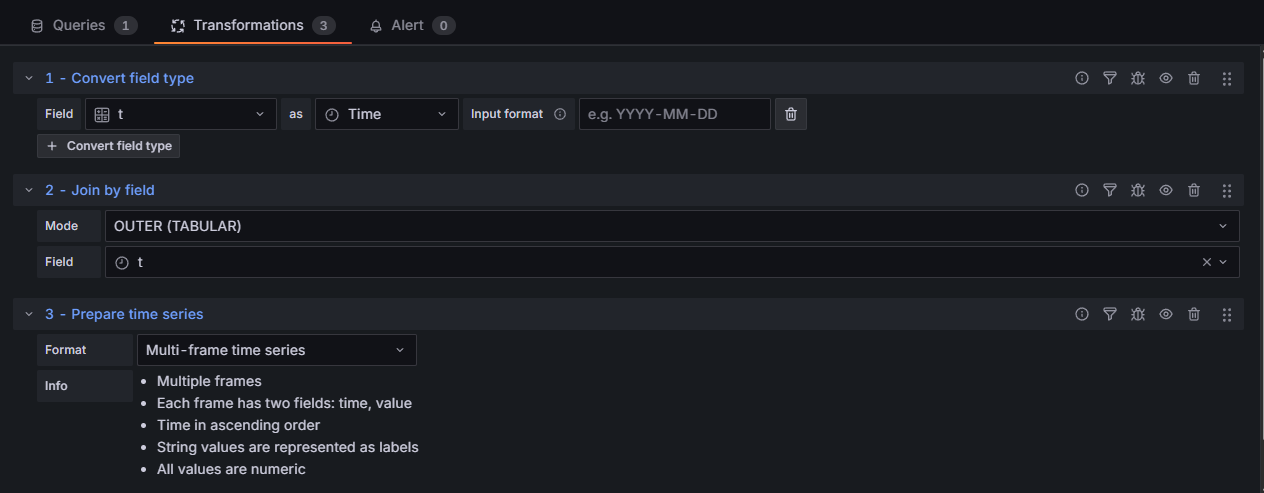
@yosiasz , can you please let me know what transformation did you use ? is it convert field type ?
It is most probaly just to convert time.