Introduction
I am deploying Loki, Promtail, Tempo (single binary mode), Prometheus, and Grafana to a 3-node K3s cluster where I intend to run other applications (exposing web services) that I want to instrument using these tools.
I’m deploying all of this with Helm and I made my own chart of charts so I can deploy this monitoring/observability stack all together. These are my chart dependencies which shows the specifics of what I’m deploying and which Helm charts are being used:
dependencies:
  - name: prometheus  # includes: prometheus server, alertmanager, and pushgateway
    version: 15.1.1
    repository: https://prometheus-community.github.io/helm-charts
  - name: loki-stack   # includes: loki and promtail
    version: 2.5.1
    repository: https://grafana.github.io/helm-charts
  - name: tempo
    version: 0.13.0
    repository: https://grafana.github.io/helm-charts
  - name: grafana
    version: 6.21.0
    repository: https://grafana.github.io/helm-charts
  - name: opentelemetry-collector
    version: 0.8.1
    repository: https://open-telemetry.github.io/opentelemetry-helm-charts
    alias: otel-collector
The actual web service applications I’m deploying are .NET 6 applications using the OpenTelemetry .NET Library so I am using the OpenTelemetry-Collector as an agent to receive trace data from my .NET app and send it to Tempo. Logs are collected from my cluster pods using Promtail and sent to Loki. I have also set up a “derived field” in Loki which grabs the OpenTelemetry Trace Id from my logs so I can link over to the Tempo traces.
My Grafana chart values file looks like this:
grafana:
  grafana.ini:
    server:
      domain: my-cluster-hostname.mydomain.org
      root_url: "%(protocol)s://%(domain)s/grafana"
      serve_from_sub_path: true

  ingress:
    enabled: true
    ingressClassName: nginx
    path: /grafana
    pathType: Prefix
    hosts:
      - my-cluster-hostname.mydomain.org
    tls:
      - secretName: cluster-tls-cert
        hosts:
          - my-cluster-hostname.mydomain.org

  admin:
    existingSecret: grafana-admin-credentials
    userKey: admin-user
    passwordKey: admin-password

  ## Configure grafana datasources
  ## ref: http://docs.grafana.org/administration/provisioning/#datasources
  ##
  datasources:
    datasources.yaml:
      apiVersion: 1
      datasources:
      - name: Prometheus
        type: prometheus
        uid: prometheus
        access: proxy
        url: http://obs-prometheus-server.obs:9090
        version: 1
      - name: Loki
        type: loki
        uid: loki
        access: proxy
        url: http://obs-loki.obs:3100
        version: 1
        jsonData:
          derivedFields:
          - datasourceUid: tempo
            matcherRegex: .*\,\"TraceId\":\"(\w+)\"
            url: '$${__value.raw}'
            name: TraceID
      - name: Tempo
        type: tempo
        uid: tempo
        access: proxy
        url: http://obs-tempo.obs:3100
        version: 1
There you can see my data sources include Prometheus, Loki, and Tempo. The URLs point to my K8s services which are named obs-prometheus-server, obs-loki, and obs-tempo and are also in the namespace obs. AFAIK the ports are correct as well based on examples I’ve found online (though they’re not always the same across guides/articles which is confusing).
The problem
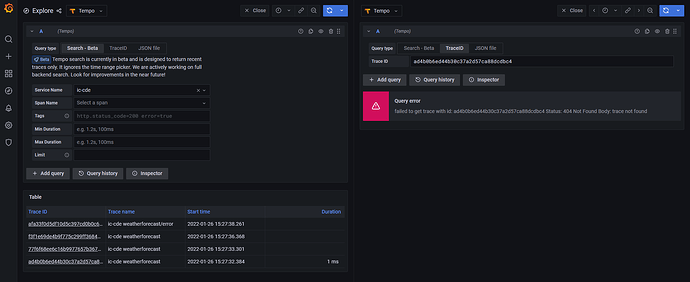
Now for some time while I’m running my application and it is producing logs and traces, I see data in Loki and Tempo inside Grafana (I go to Explore and pick the associated data source). I can even jump from Logs in Loki to Traces in Tempo but then suddenly, I can not find any logs or traces that were previously there as little as an hour ago. If I restart promtail, loki, and tempo (which are deamonsets or statefulsets), I magically start getting logs and traces again but it’s been extremely frustrating when it just suddenly stops working even though my pods are all running without obvious issues.
I’m hoping it’s just something with my deployment approach that is wrong and someone can provide feedback. I’ve already shared my grafana chart values above but the following are the other chart settings:
loki-stack chart values
loki-stack:
  loki:
    enabled: true
    replicas: 3
    persistence:
      enabled: true
      accessModes:
      - ReadWriteOnce
      size: 10Gi
      # storageClassName: local-path
      annotations: {}
    config:
      limits_config:
        retention_period: 336h
      compactor:
        compaction_interval: 10m
        retention_enabled: true
        retention_delete_delay: 2h

## tempo chart values
```yaml
tempo:
  replicas: 3
  tempo:
    retention: 24h
    receivers:
      otlp:
        protocols:
          grpc:
            endpoint: "0.0.0.0:4317"
    resources:
      requests:
        cpu: 500m
        memory: 500Mi
      limits:
        cpu: 1000m
        memory: 1Gi

  persistence:
    enabled: true
    # storageClassName: local-path
    accessModes:
      - ReadWriteOnce
    size: 10Gi
opentelemetry collector chart values:
otel-collector:
  config:
    exporters:
      otlp:
        endpoint: obs-tempo.obs:4317
        tls:
          insecure: true
    extensions:
      health_check: {}
      memory_ballast: {}
    processors:
      batch: {}
      # If set to null, will be overridden with values based on k8s resource limits
      memory_limiter: null
    receivers:
      jaeger: null
      prometheus: null
      zipkin: null
      otlp:
        protocols:
          grpc:
            endpoint: 0.0.0.0:4317
    service:
      extensions:
        - health_check
        - memory_ballast
      pipelines:
        logs: null
        metrics: null
        traces:
          exporters:
            - otlp
          processors:
            - memory_limiter
            - batch
          receivers:
            - otlp

  agentCollector:
    enabled: false

  standaloneCollector:
    enabled: true
    replicaCount: 3
    resources:
      requests:
        cpu: 500m
        memory: 500Mi
      limits:
        cpu: 1000m
        memory: 1Gi
The request
I don’t see any errors in my OpenTelemetry-Collector pod and my .NET app appears to be reporting traces to it successfully (I enabled the otel collector debug output and I can see it claiming to send traces to Tempo).
I also don’t see any obvious errors in Promtail, Grafana, Loki, or Tempo pod logs…
Am I doing something wrong with my deployment here? I have 3 Loki pods running, 3 Tempo pods, 3 Promtails, and 1 Grafana. It sometimes works but then stops working (i.e. not showing traces and logs).

