Hi there
I’m using grafana cloud and grafana agents to collect logs from different endpoints
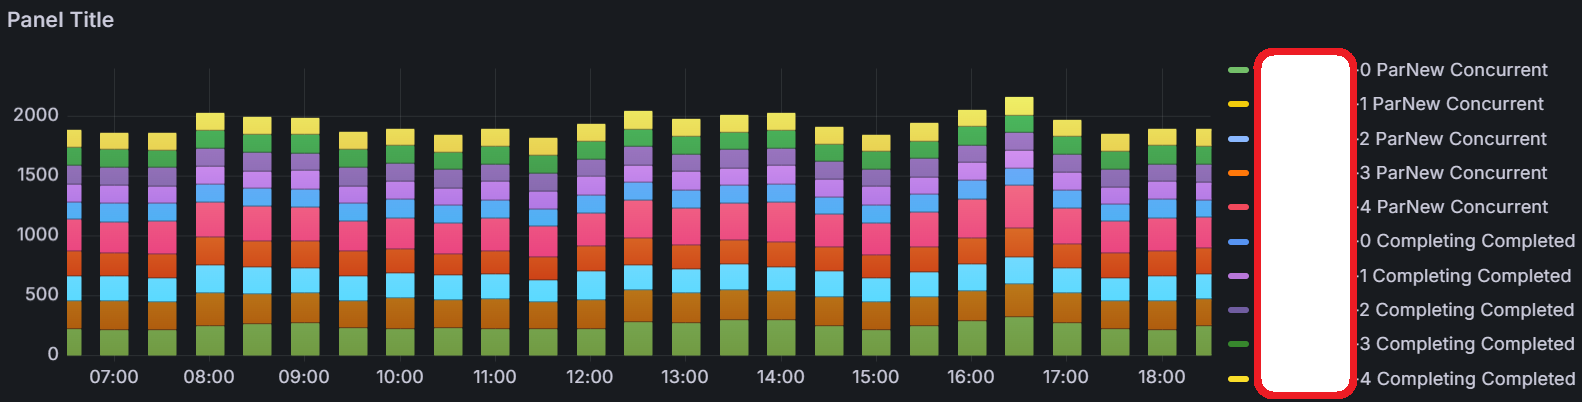
I would like to create a dashboard that looks like this: (Please, if someone knows the name of this type of representation, pls tell me)
Im quering to get different combinations of messages for a group of instances, lets call the instances server*
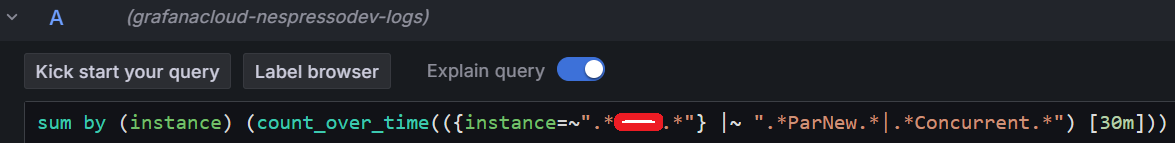
I get one group of instances errors by using this query:
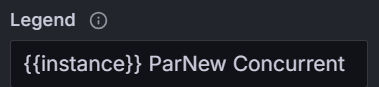
And this settings for the legend:
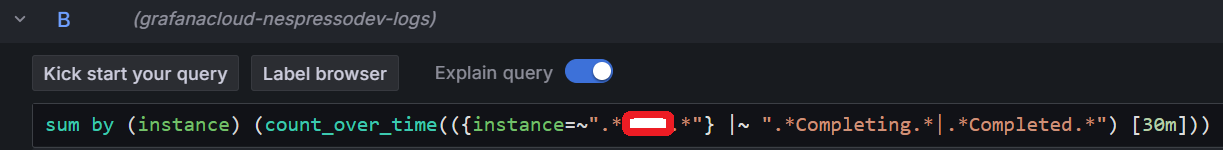
I get a second group with a second query:
And this settings for the legend:

This is just a test. I will replace the strings to martch for Production purposes later.
The thing is, I need to fit with 37 different error messages so I will have to create 37 queries like the two previous I’ve shown where the instances values are always the same but the strings to match are different, and I’m a little worried about how efficient is this way to achieve my goal in terms of HW resources utilization.
Can someone please share any idea or give an opinion.
Thank you very much in advances.
Regards.
Carlos T