Time series will not render tomorrow's data

  • Grafana 12.2.0 on Ubuntu

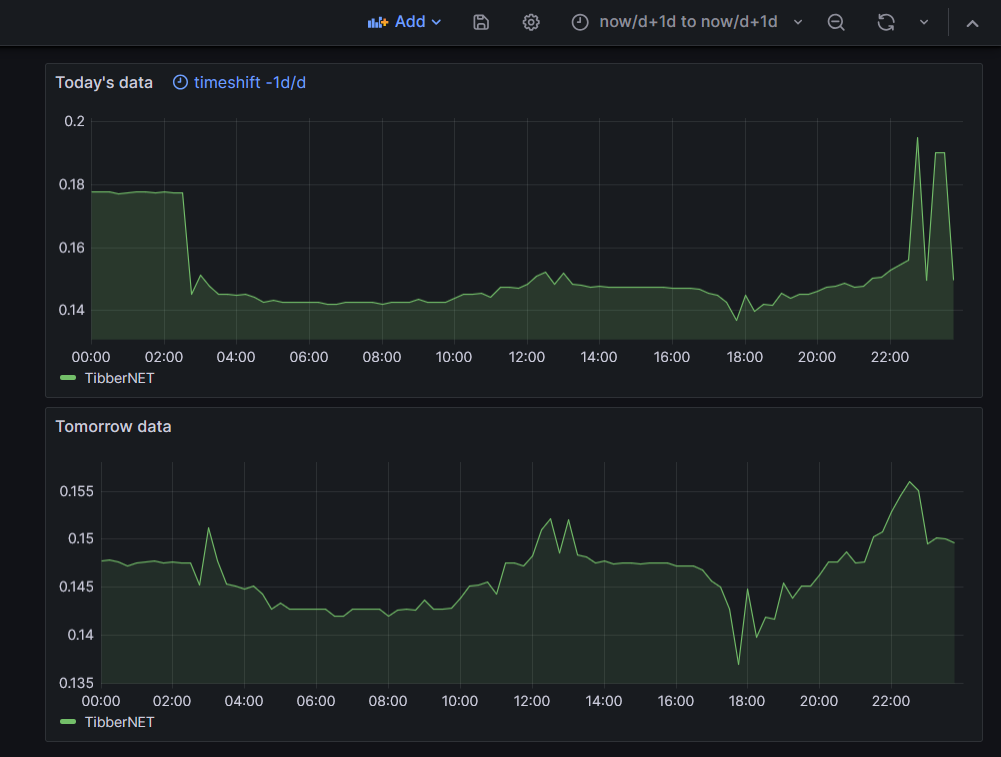
  • I want to create a plot of day-ahead electricity prices with an x-axis that covers a full day (midnight-midnight) and data for tomorrow.

  • I have an InfluxDB query that shows correct results (96 records) in both the InfluxDB GUI and the Grafana table view option.

  • What happened? The time series is not rendered and I get “Data outside time range”. I’ve tried many different combinations of query options, particularly relative time and time shift. None of these were successful. With some settings I get a rendered time series but the x-axis stops at the current time. The query sets the start and stop values at midnight tomorrow and the day after tomorrow and InfluxDB and Grafana honor start and stop but not in the visualization. Rendering the data as a bar chart works as expected but that’s not a solution for me.

  • What did you expect to happen? I expect a normally rendered time series with an x-axis as described.

  • Can you copy/paste the configuration(s) that you are having problems with? I have tried 6 combinations of relative time and time shift and can post these if required. Setting the time picker to tomorrow is not an option as it affects the whole dashboard.

  • Did you receive any errors in the Grafana UI or in related logs? If so, please tell us exactly what they were. Sometimes I get ‘illegal time shift’ and I’ve come to the conclusion that time shifts like “+1d” are not supported.

I would like to know if my conclusion that Grafana will not render time series like described, is correct and it not what I should change.

Did you try such combination?

image

Can you share some sample data that you can see in Table view, but can’t see on Time Series panel?

That’s an interesting combination that I hadn’t tried yet. As you can see, the data is rendered, but the x-axis is 48hrs. instead of 24hrs.

Here’s the data for tomorrow:
“Time”,“TibberNET”
00:00,€0.15114
00:15,€0.14772
00:30,€0.14531
00:45,€0.14513
01:00,€0.14475
01:15,€0.14508
01:30,€0.14430
01:45,€0.14274
02:00,€0.14330
02:15,€0.14267
02:30,€0.14266
02:45,€0.14265
03:00,€0.14266
03:15,€0.14265
03:30,€0.14198
03:45,€0.14193
04:00,€0.14272
04:15,€0.14271
04:30,€0.14271
04:45,€0.14271
05:00,€0.14197
05:15,€0.14263
05:30,€0.14266
05:45,€0.14263
06:00,€0.14361
06:15,€0.14272
06:30,€0.14270
06:45,€0.14276
07:00,€0.14382
07:15,€0.14508
07:30,€0.14518
07:45,€0.14556
08:00,€0.14432
08:15,€0.14749
08:30,€0.14750
08:45,€0.14720
09:00,€0.14826
09:15,€0.15097
09:30,€0.15218
09:45,€0.14853
10:00,€0.15201
10:15,€0.14833
10:30,€0.14820
10:45,€0.14752
11:00,€0.14770
11:15,€0.14740
11:30,€0.14754
11:45,€0.14756
12:00,€0.14745
12:15,€0.14755
12:30,€0.14757
12:45,€0.14747
13:00,€0.14723
13:15,€0.14724
13:30,€0.14720
13:45,€0.14683
14:00,€0.14566
14:15,€0.14502
14:30,€0.14271
14:45,€0.13696
15:00,€0.14476
15:15,€0.13973
15:30,€0.14187
15:45,€0.14170
16:00,€0.14547
16:15,€0.14387
16:30,€0.14509
16:45,€0.14513
17:00,€0.14629
17:15,€0.14758
17:30,€0.14762
17:45,€0.14870
18:00,€0.14756
18:15,€0.14767
18:30,€0.15026
18:45,€0.15074
19:00,€0.15291
19:15,€0.15453
19:30,€0.15602
19:45,€0.15506
20:00,€0.14950
20:15,€0.15012
20:30,€0.15002
20:45,€0.14960
21:00,€0.14772
21:15,€0.14779
21:30,€0.14760
21:45,€0.14723
22:00,€0.14754
22:15,€0.14760
22:30,€0.14768
22:45,€0.14752
23:00,€0.14758
23:15,€0.14756
23:30,€0.14750
23:45,€0.14522
And here’s the plot as it should look like but with today’s data:

Note that the above data only shows HH:mm timestamps (probably because that’s the format specified in the panel) but that InfluxDB delivers full timestamps: ‘2025-10-04T22:00:00.000Z’.

With dashboard configured to now/d+1dnow/d+1d you can see both time series for today and tomorrow:

Query options for today’s panel (1d/d for time shift):

Your strategy isn’t clear to me. ‘now/d+1d’ is not accepted by Grafana. I also realized that it’s difficult for you to simulate this. Tomorrow’s data can only be rendered as tomorrow’s data if the data has full timestamps for tomorrow but is rendered today (i.e. you run the panel today with tomorrow’s data).

In my example above I used this range in Grafana’s date picker:

That’s exactly what was shown in my example above.

Sample data that I used for tomorrow’s panel (no relative time or time shift specified in query options):

Sample data for today’s panel (time shift is 1d/d):

Idea was to show that it is possible to have on the same dashboard panel with today’s data and panel with tomorrow’s data.

Another way is to play with timeShift function in query if you are using flux.

Ok, now I get it: you’re changing the time range for the dashboard and not for the panel. Unfortunately that’s not an option for me as other panels are impacted as well. A timeshift in Flux does work but changes the hover data in the panel. Anyway thanks for trying; I’ll continue searching for a solution.

Where you able to find a solution, I am currently trying to implement the same use case

Your post was the final trigger I needed to solve this. The solution is a nasty hack, inspired by @ebabeshko. Let me explain:

  • set the time picker like this:

  • don’t set any query options for tomorrow’s data

  • today’s data will no longer render so in the query options for panels thaat show today’s data, time shift must be set to 1d, like this:

  • this must be done for all panels that show today’s data

  • this results in a dashboard that correctly renders today’s and tomorrow’s data:

@ebabeshko: thanks for pointing me in the right direction.

I strongly believe Grafana should support this out of the box, without the need to edit all panels for today’s data.

2 Likes