- What Grafana version and what operating system are you using?
Operating system is RHEL 8.7
Grafana version is 10.0.2 - What are you trying to achieve?
What I wanted to achieve is to visualize the CPU utilization of Solaris servers from shell script. - How are you trying to achieve it?
I have setup a shell script in Solaris server to push the metrics for CPU used percentage by getting the stat from vmstat command. - What happened?
What I tried to achieve was been successful and the script accurately pushes the metrics as expected. - What did you expect to happen?
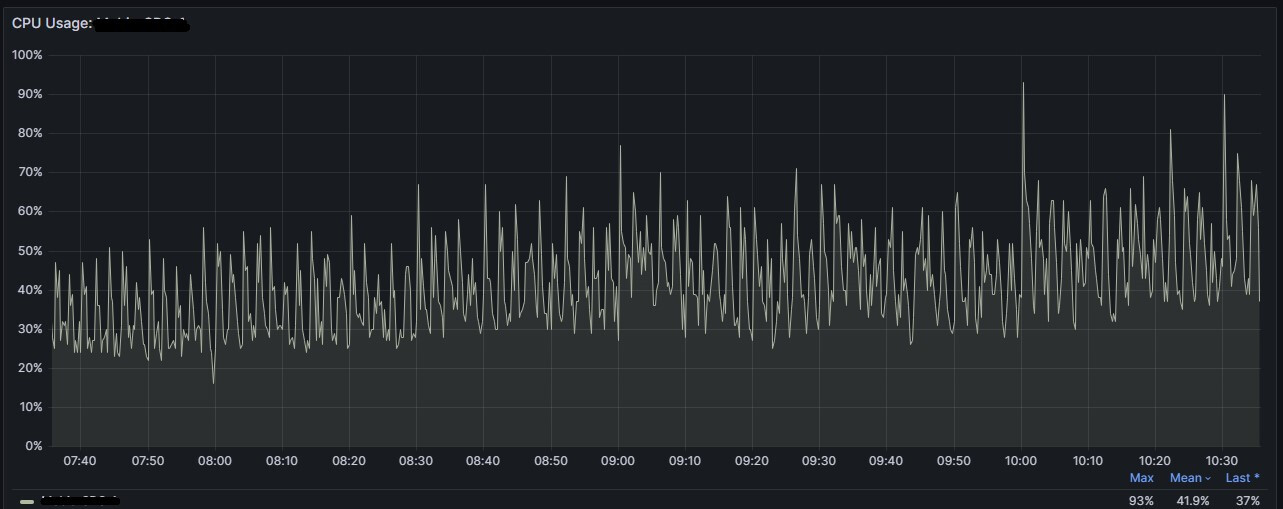
Even though the graphs accurately show the metrics when the time range was shorter like one hours or three hours; but when I switched the time range to longer period like 12 hours or 24 hours, the small spikes in the graphs were missing. I haven’t used any range functions in the query. Just used the metric name only. It would be really helpful if I can know the reason or if I can change something on the query or Grafana configurations, so the max values or short timed spikes won’t be missed when analyzing with longer time range selected. - Can you copy/paste the configuration(s) that you are having problems with?
Last 1 hour:

Last 3hour:
Last 12 hour:
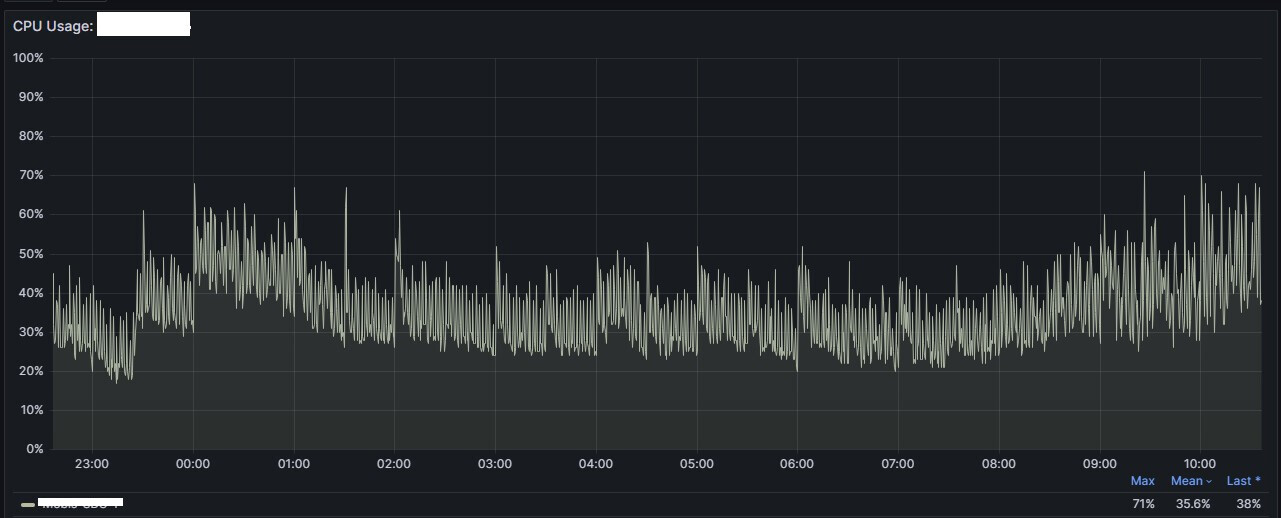
Last 2 days:

As you can see in the attached screenshots the max spikes shown in last 3 hours and last 1 hour are not shown in last 12 hours.
The query I used is just the metric name without any operations:
- unix_cpu_used_percentage {instance=“server”}
Appreciate if someone can suggest any solution by modifying queries or implementing something to not lose the max spikes when the time range changes to longer period.
- Did you receive any errors in the Grafana UI or in related logs? If so, please tell us exactly what they were.
Didn’t receive any errors in Grafana UI or logs. - Did you follow any online instructions? If so, what is the URL?