Hello,
I’m new to Grafana and i’m trying to create a table for my energy consumption data, that is stored in InfluxDB, like HourlyHeatmap/CarpetPlot plugin. Is this possible and how can i do it?
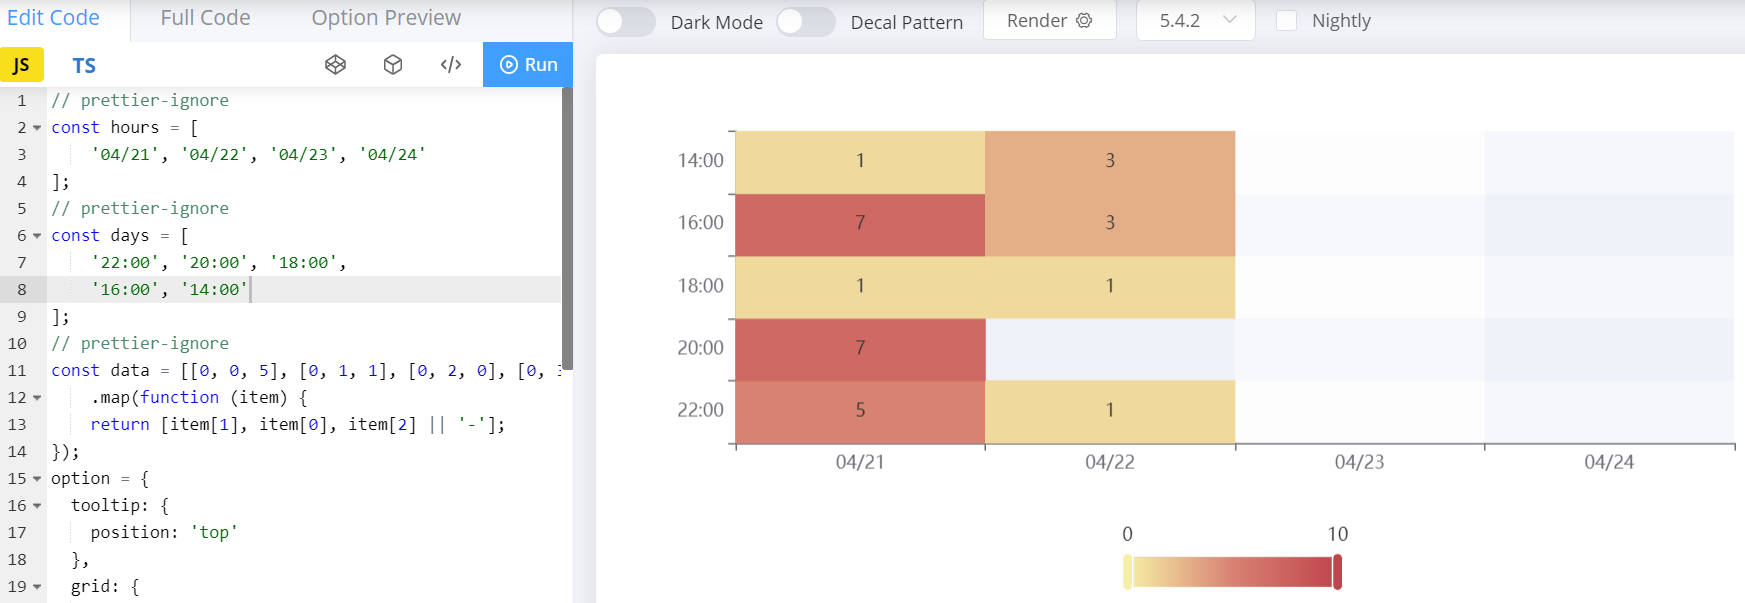
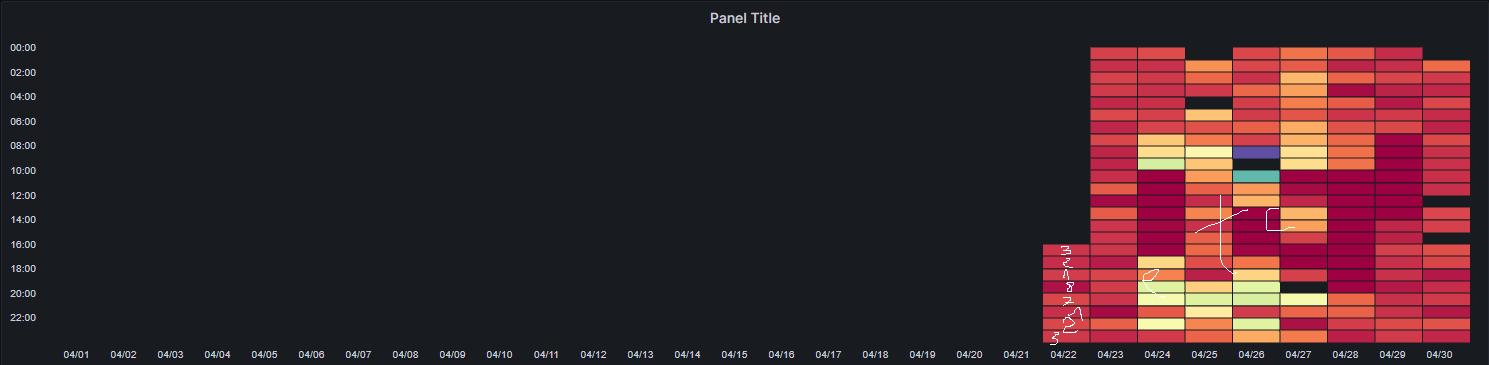
Basically, i want to have 24 rows for each hour and 30 columns for each day and write data according to these.
Can anyone help me ?
I’m using Grafana 9.4.7 and InfluxDB.